Case Study on Data Visualization
Challenges:
Several challenges emerged as impediments to efficient data visualization implementation.
- Data Fragmentation: Data resided in different systems, leading to fragmentation and difficulty in presenting a unified view. Therefore, pulling data from various sources was a challenging task.
- Format Divergence: Data is maintained by various property management firms having different charts of accounts for the financial statements, which requires cleaning and transformation of data to form a single database to be used for visualization.
- Real-Time Insights: The need for up-to-date, real-time insights from disparate data sources presented a significant challenge.
- User-Friendly Interface: There can be multiple users for the visualized data like Investors, Property Managers, Owners. Designing a user-friendly interface for diverse stakeholders posed a crucial challenge.
- Scalability: Ensuring scalability for future data growth and additional properties was a key concern. Merging the new data source with a single database requires us to follow the same procedure of cleaning and transformation.
Solution:

Integrated Data Platform:
A unified data platform was implemented to centralize information from diverse sources, facilitating seamless integration and accessibility.
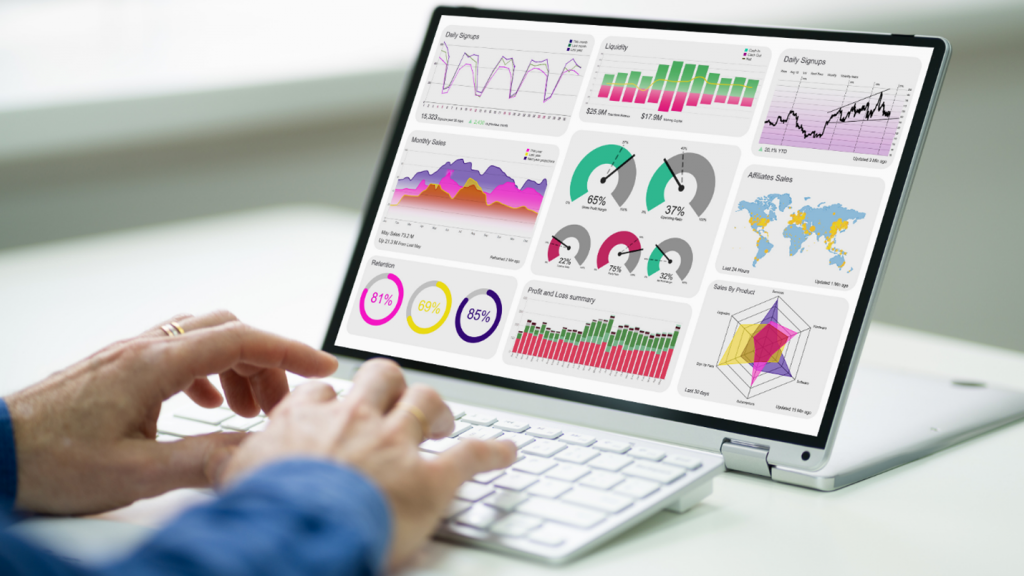
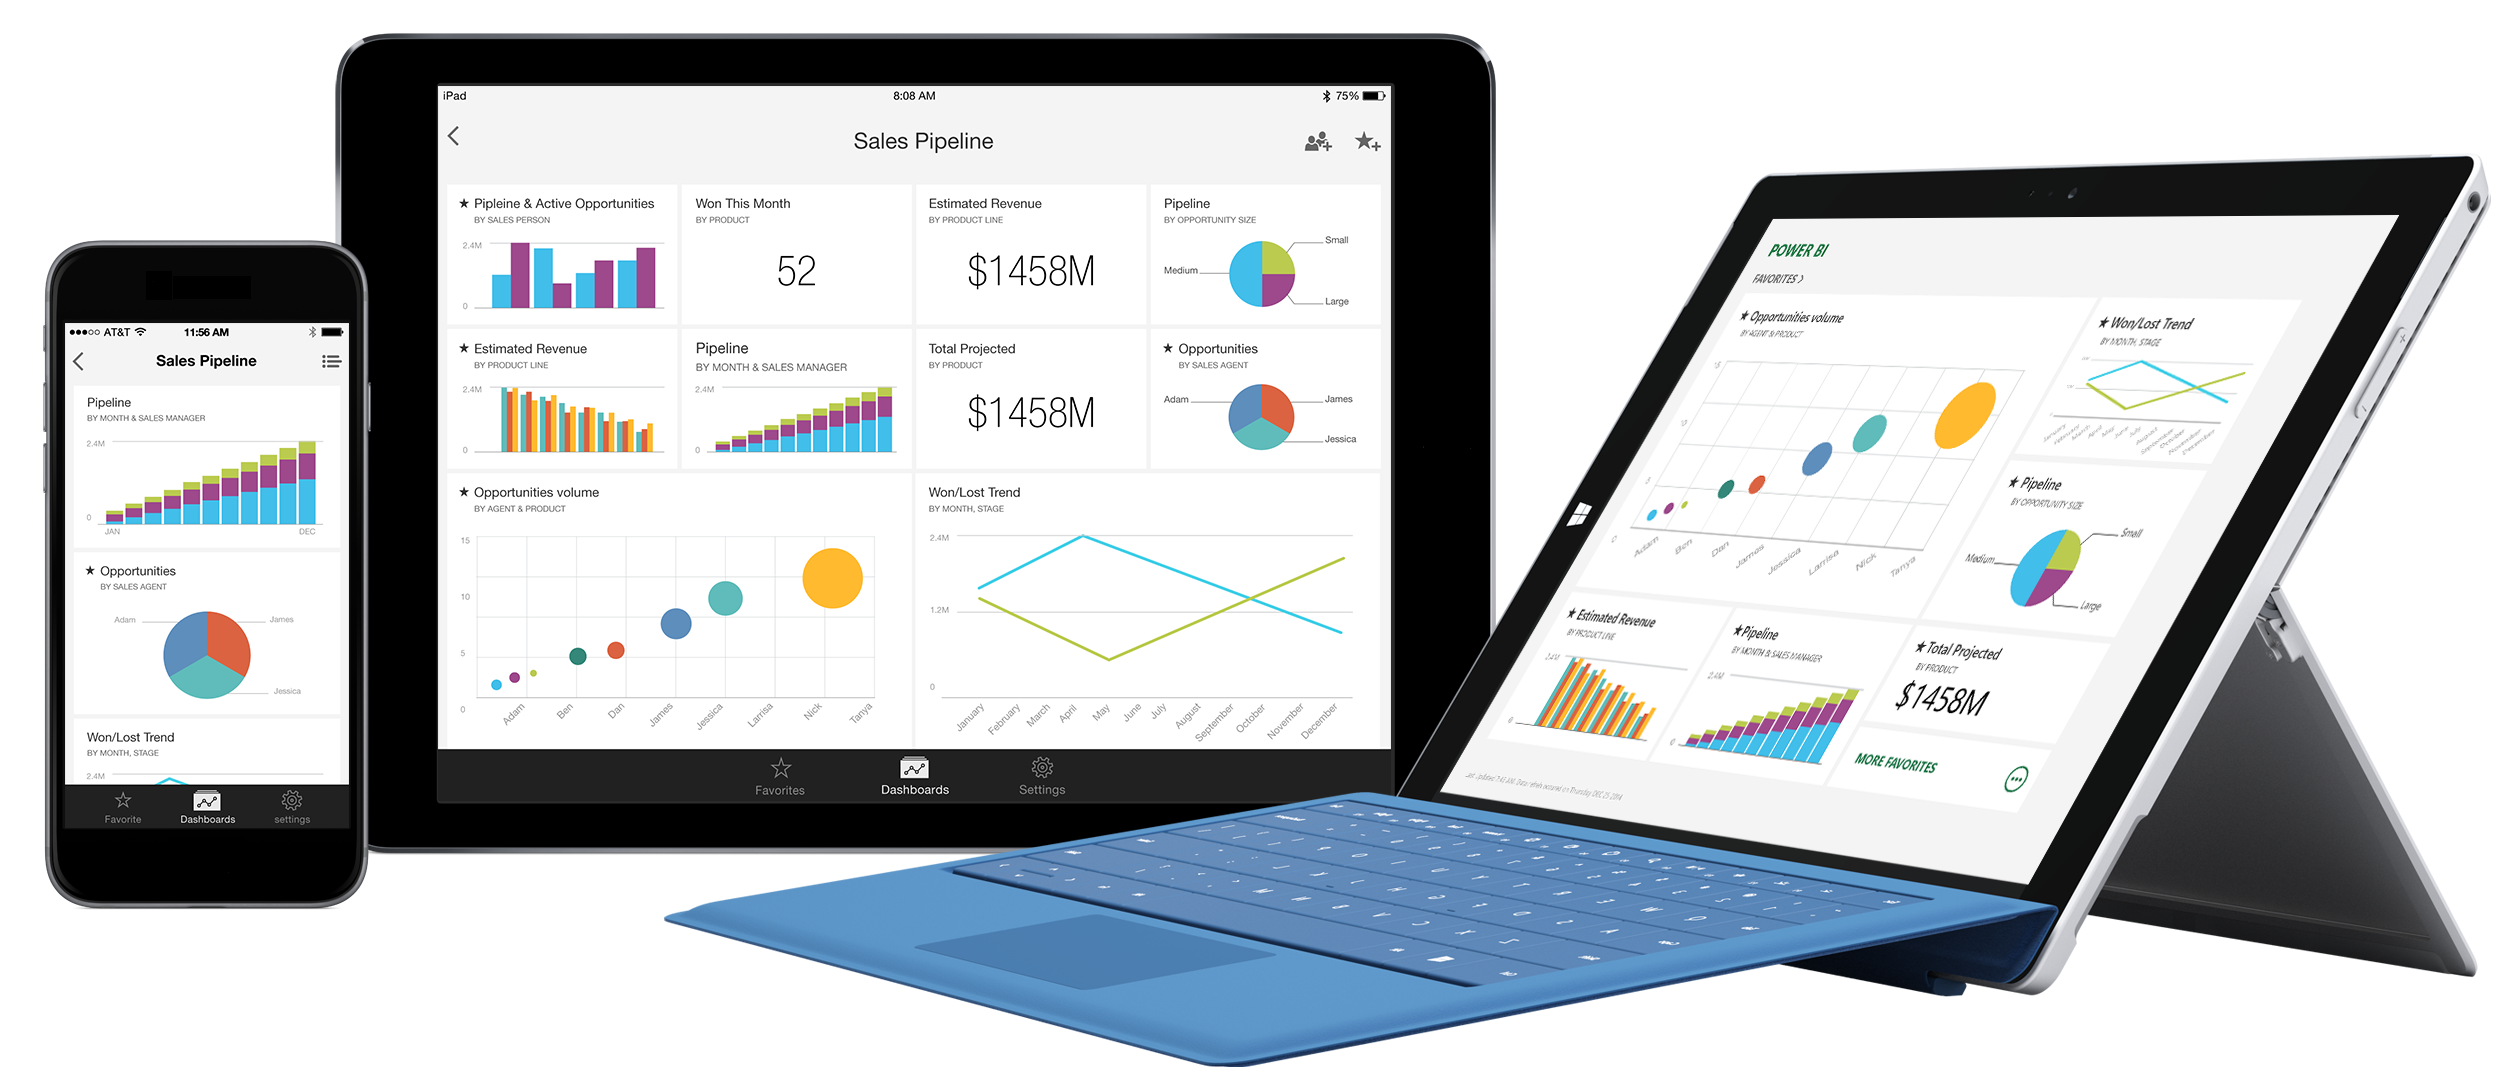
Customizable Dashboards:
Tailored dashboards were designed to provide real-time insights, allowing stakeholders to visualize and interpret data effectively.
Automation and AI:
Various automation tools were implemented to make AI- driven analysis of data and to streamline data processing, enabling quick and accurate visualization.

User Training:
User guides were provided to enable the audience to interact with dashboards and Comprehensive training programs were conducted to empower users in navigating and leveraging the new data visualization tools.
Scalable Architecture:
Scalable architecture was adopted to accommodate future data growth and evolving visualization needs in such a way that future requirements can be scaled up and down accordingly.
Result:
Real-time Insights for Stakeholders:
Stakeholders now access real-time insights, leading to more informed decision-making towards marketing hence increased occupancy by 14%.
Increased Profitability:
Increased profitability by 9% due to cost savings by reducing time of Property Managers spent on dealing with multiple reports.
Data Analysis and Visualization:
Firm also analyzing its data through visualization to see the hidden pattern in vacancies, move in, Move Outs to understand tenant behaviors.
Effective Work Order Handling:
Now they are handling work order more effectively hence that improved their grievances handling which leads to tenant satisfaction.
Delinquency Tracking:
Tracking the Delinquency has made Firm able to collect Delinquent Rent timely.
If you are interested in knowing more about how OHI can help your organization, please email us at  info@outsourcinghubindia.com/
sales@outsourcinghubindia.com or call us at  +1-646-367-8976 (US) /
+44 20360 83041 (UK) /
91-11-26475715 (India). We can also provide a cost-benefit analysis customized for your organization.