40-60% Cost Savings

Experienced Team

300+ Clients in USA

At OHI, with 19+ years of expertise, we enhance business performance through Data Visualization and BI services. Using Power BI, we deliver intuitive visuals for over 10 key real estate KPI’s, including occupancy, collection factor, and net operating income, enabling informed decision-making.
Our solutions improve expense tracking and drive profits, seamlessly integrating with platforms like Argus, Excel, Yardi, and AppFolio. Trust OHI to transform your real estate business into a data-driven success.


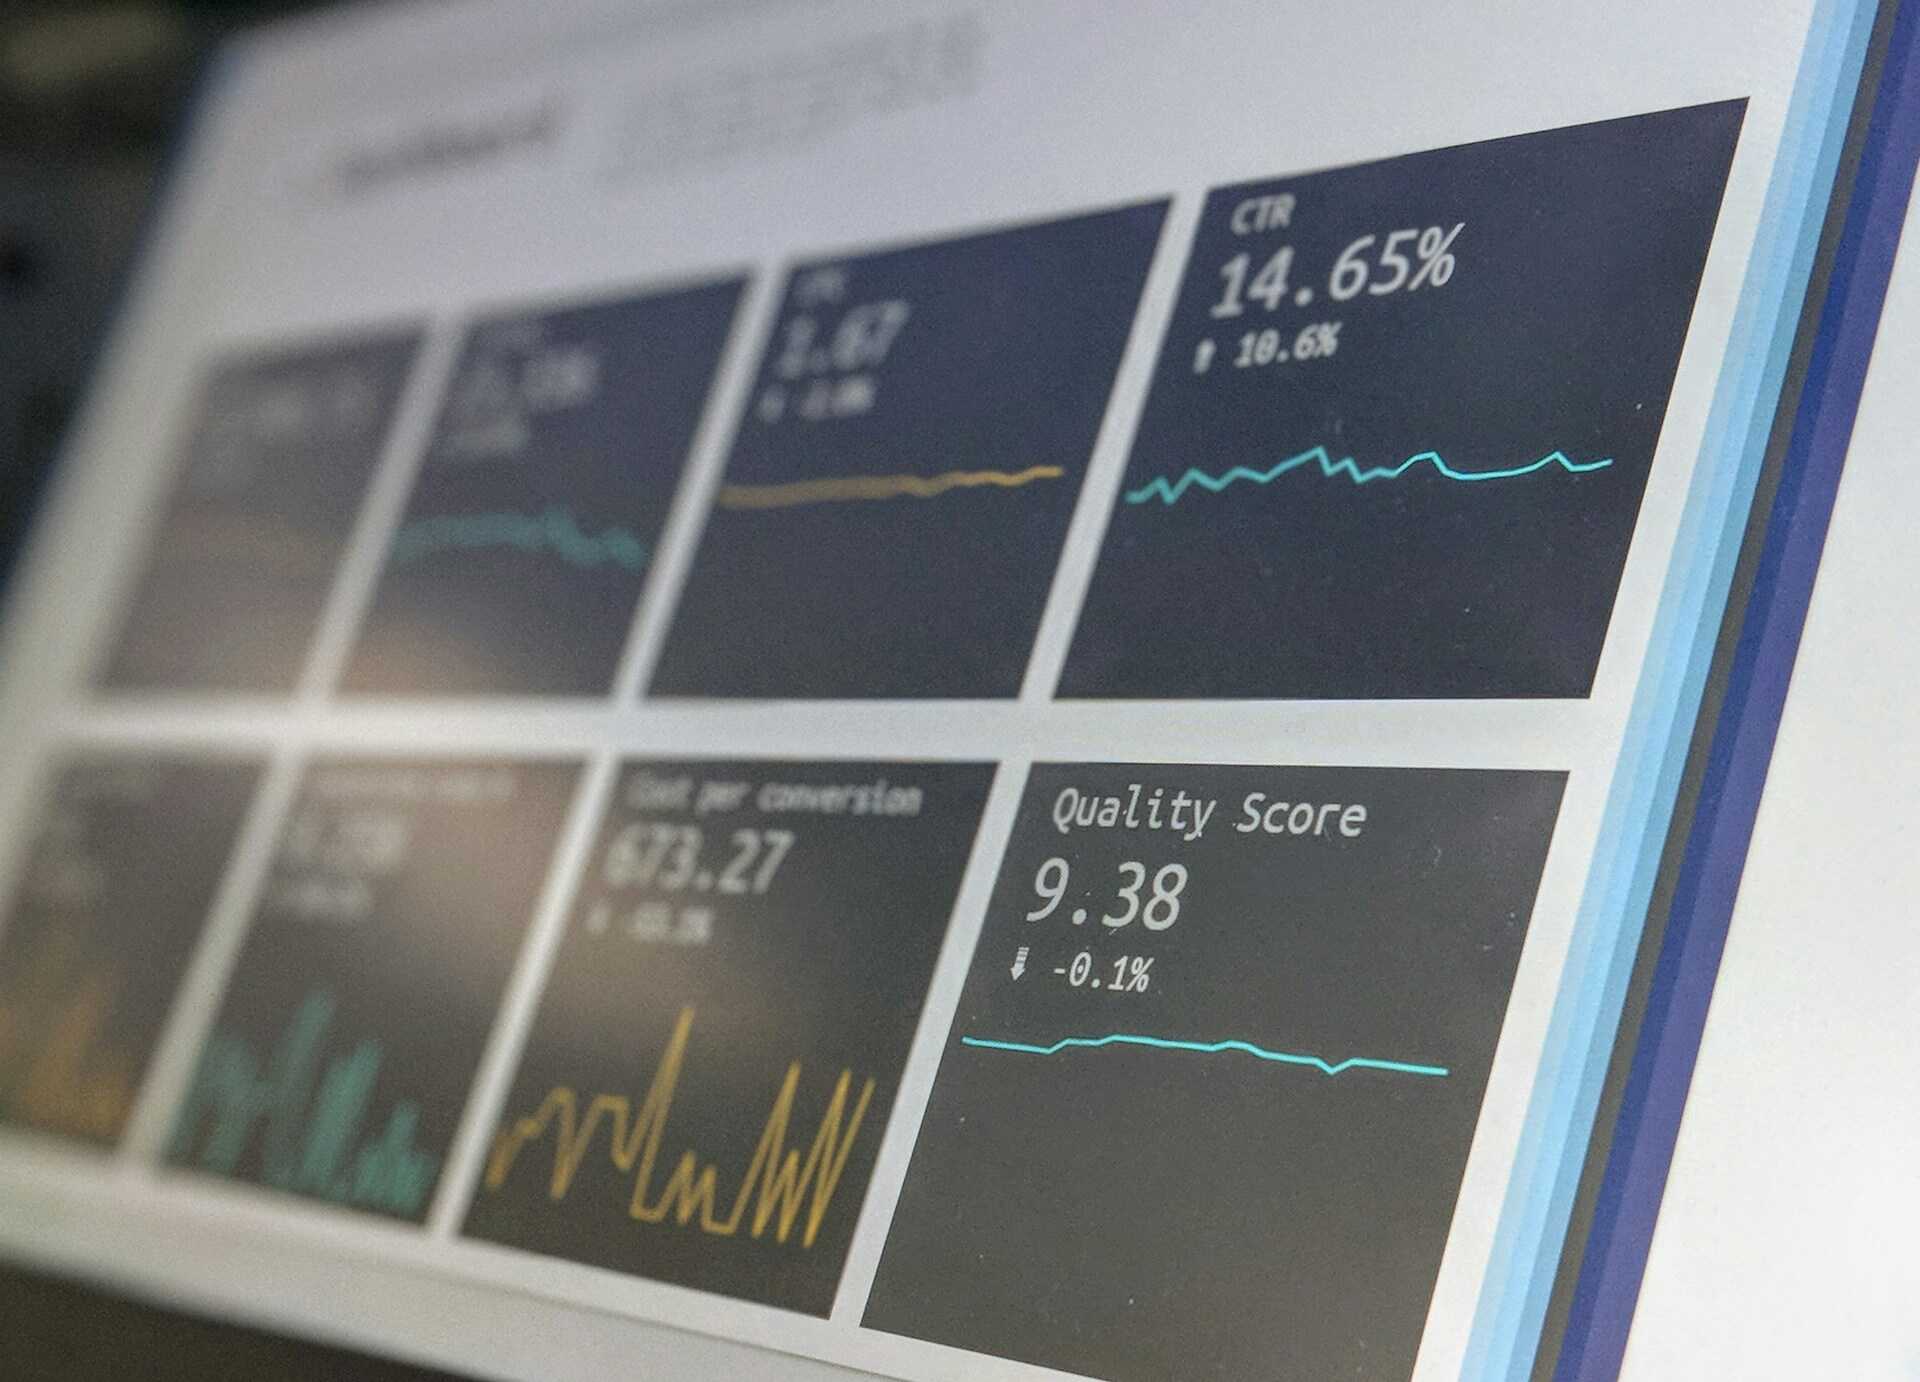
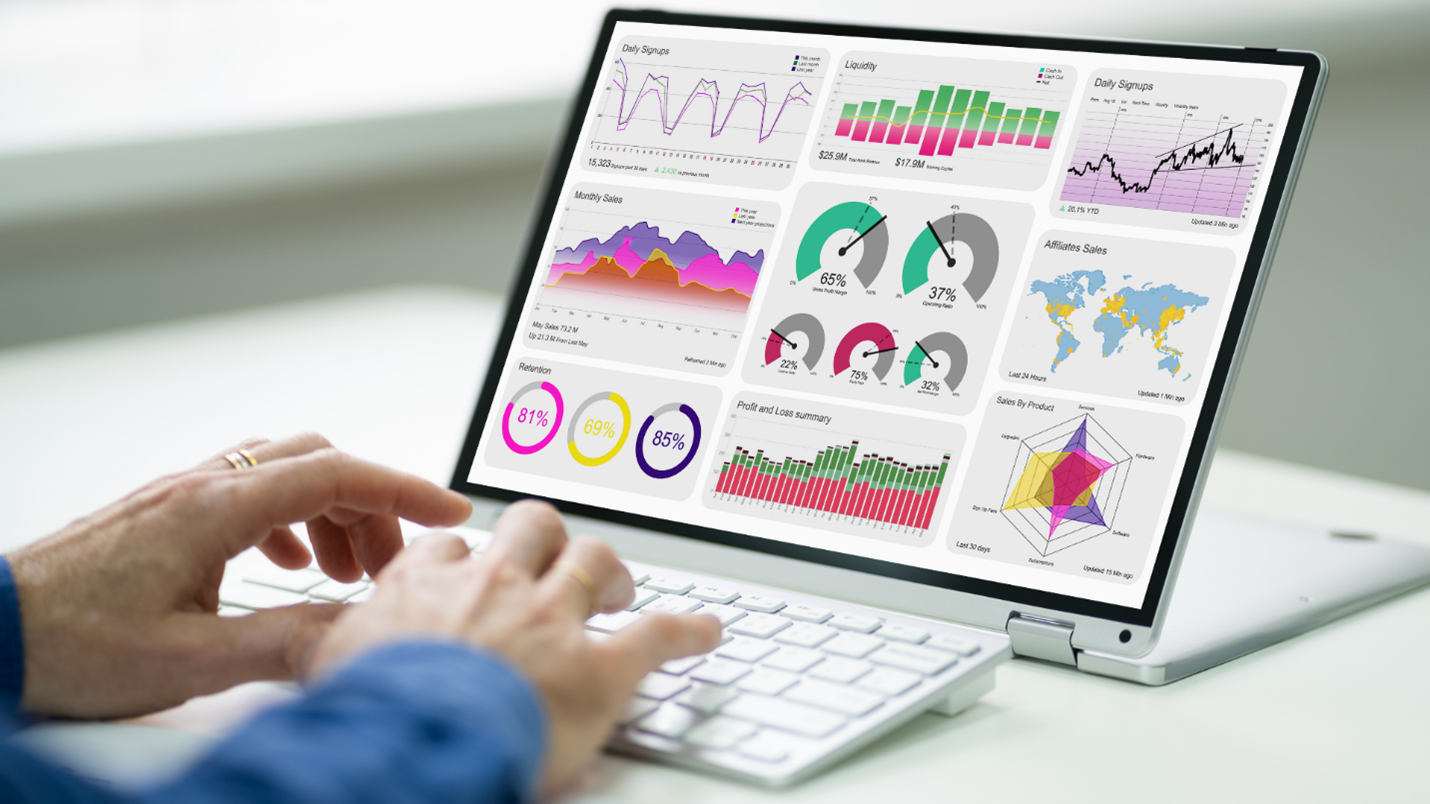
Dashboards deliver clear visual data, helping you spot key insights instantly. 74% of executives say data visualization boosts business understanding—unlock smarter insights with our services today.
Dashboards can be as detailed as needed—view data by ratios, variances, trends, or comparisons like actual vs. budget or YTD. We tailor visualizations to your needs. Gain clarity with our data visualization and BI services.
Well-designed dashboards help owners track key drivers beyond just revenue and profit. Real estate firms, for example, can monitor vacancies, collections, concessions, and expenses to boost rental income and NOI. Unlock deeper insights with our data visualization services!
Well-crafted dashboards offer clear, real-time visuals of key data, enabling quicker decisions and improved efficiency. Get the insights you need with our data visualization services.
Dashboards can be tailored for each user, showing only the most relevant insights for their role. This ensures smarter analysis and more effective decisions. Experience the power of Power BI and the benefits of data visualization outsourcing.


For real estate companies, we offer a standard fixed cost dashboard solution, that’s been outlined below. Applicable for firms managing less than 500 units.
Our standard fixed cost dashboard solution will cover the following:
Property Performance Executive Summary
A simple one paragraph executive summary that crisply summarizes the property’s operational and financial performance.
Property Dashboard
Vacancy Section
Rental Income Section
Financial Summary

Our custom real estate dashboards cover:


Our indicative standard charges for the above solution is defined here. Custom quote available based on your requirements and number of properties/units.


OHI offers expertise in turning raw data into meaningful visuals and analytics, empowering businesses to make data-driven decisions effectively.
We provide end-to-end data visualization and BI solutions, from data collection and analysis to creating intuitive dashboards and reports.
OHI employs industry-leading tools and technologies, including Power BI, Tableau, and custom solutions, to deliver tailored data visualization and BI services.
We can integrate data from various sources, including databases, spreadsheets, cloud platforms, and APIs, to provide a comprehensive view of your data.
Yes, we specialize in creating custom dashboards and reports tailored to your specific business needs and key performance indicators (KPIs).