
How Variance Analysis Helps Real Estate Firms Improve Forecasting and Risk Management
- December 3, 2025
- Tajinder Malhotra
Real estate firms face a critical challenge. Financial leaders managing property portfolios across multiple locations struggle with accuracy when predicting performance, controlling costs, and managing risks. Without the support of property accounting services, even minor deviations between actual expenses and budgets or when rental income falls short of forecasts can create major disruptions. These discrepancies ripple through operations, audit processes, and stakeholder confidence.
The real estate market reached $4.14 trillion in 2024, growing to $5.87 trillion by 2029 at a 7.1% compound annual growth rate. Within this massive industry, property management software adoption continues accelerating, with the market growing from $3.2 billion in 2023 to a projected $7.8 billion by 2033 at 8.9% annually. Yet, despite technological advances, many real estate controllers and CFOs still rely on manual processes to compare actual performance against budgets.
Variance analysis solves this problem. It provides a structured, data-driven method to identify why actual financial results differ from forecasts, enabling controllers, CFOs, and managers to make smarter decisions and mitigate risks before they escalate.
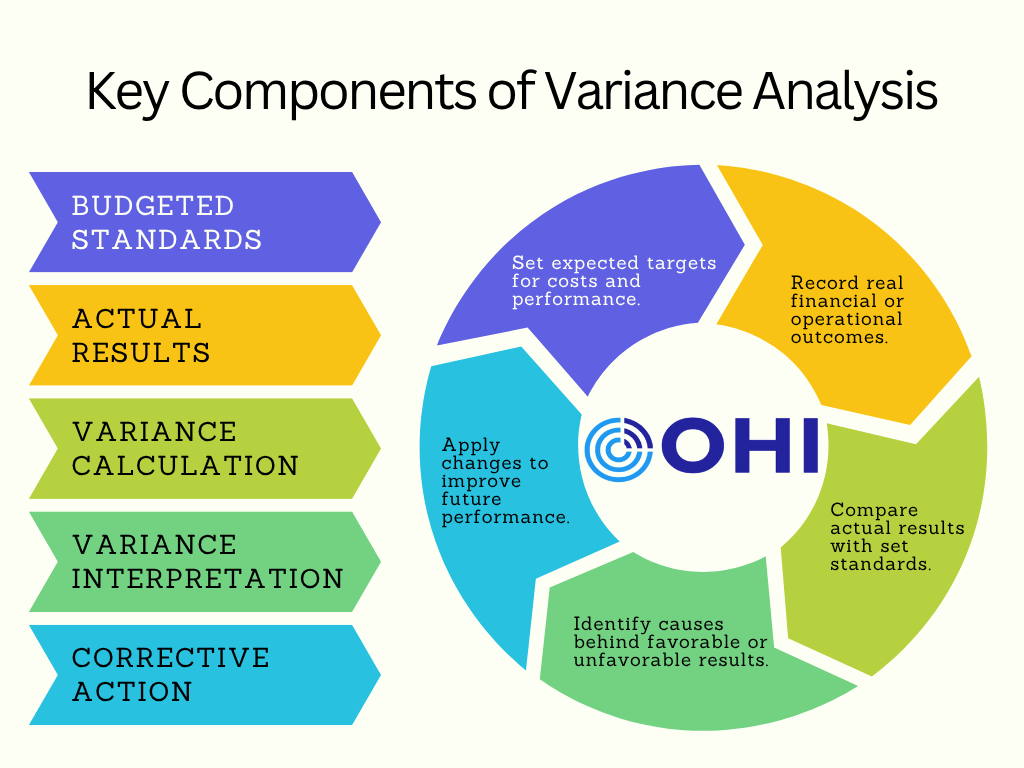
Variance analysis is the process of comparing budgeted or forecasted amounts against actual results, calculating the differences (variances), and investigating the root causes of those deviations. It’s more than just identifying problems—it’s about understanding why they occurred and using that insight to improve future planning.
For real estate professionals, variance analysis answers critical questions:
The basic principle is simple: Variance = Actual Result − Budgeted Result. When the variance is positive (favorable), it means you’ve outperformed expectations. When it’s negative (unfavorable), performance fell short.
Controllers and CFOs in real estate firms face mounting pressure. They must ensure accurate financial reporting, maintain compliance with strict regulations, prepare for audits, forecast cash flow with precision, and identify investment opportunities—all while managing incomplete, fragmented data systems.
Manual reconciliation creates bottlenecks. Data errors compound. Auditors flag discrepancies. Boards demand explanations for budget overruns. Investors lose confidence when forecasts miss the mark repeatedly.
Variance analysis transforms this reactive approach into a proactive one. Real estate accounting research shows that 60% of HOAs are underfunded in reserves, often because financial data is so disorganized that reserve needs get overlooked or misjudged. When unexpected expenses trigger special assessments, homeowner satisfaction plummets and an organization’s reputation suffers.
Controllers who implement variance analysis gain several immediate advantages:
Different variance types reveal different financial health aspects. Understanding each helps real estate teams prioritize corrective actions.
Revenue variance occurs when actual income differs from budgeted income. In real estate, this typically stems from occupancy rates, rental rates, or collection issues.
Formula: Revenue Variance = Actual Revenue − Budgeted Revenue
Example: A property management company forecasts $500,000 annual rental income at 95% occupancy. Actual revenue comes in at $475,000 due to 88% occupancy. The unfavorable variance is $25,000, or 5% below forecast.
Investigating this variance might reveal:
Expense variance measures differences between budgeted and actual operating costs. Common real estate expenses tracked include maintenance, utilities, insurance, property taxes, and payroll.
Formula: Expense Variance = Budgeted Expense − Actual Expense
A favorable expense variance means you spent less than budgeted (good news). An unfavorable variance means costs exceeded the budget (warning sign).
For example, if you budgeted $50,000 for annual maintenance but actual costs reached $62,000, your unfavorable expense variance is $12,000. This prompts investigation: Did emergency repairs drive the increase? Did supplier costs rise? Was maintenance deferred in prior years?

Capital projects like renovations, construction, or system upgrades often exceed budgets. Capital expenditure variance compares planned project spending against actual spending.
This variance type is critical because capital overruns directly impact profitability, financing requirements, and asset valuations. A construction project budgeted at $2 million that costs $2.3 million represents a 15% unfavorable variance requiring immediate analysis and corrective action.
Converting variances to percentages enables comparison across different property sizes and categories.
Formula: Variance % = (Actual ÷ Budgeted) − 1, expressed as percentage
Alternatively: Variance % = (Actual − Budgeted) ÷ Budgeted × 100
Example: If a building generated $100,000 budgeted rent but collected $105,000 actual rent:
Percentage variances help CFOs quickly identify which properties or categories are performing best and worst, making resource allocation decisions easier.
In construction or renovation projects, cost variance (CV) and schedule variance (SV) track project health.
Cost Variance (CV) = Earned Value − Actual Cost
Schedule Variance (SV) = Earned Value − Planned Value
These metrics reveal whether projects are on budget and on schedule, enabling early intervention before problems compound.
Data supports the value of variance analysis. Real estate firms that implement systematic variance tracking see measurable improvements in financial management and decision-making.
Consider a multifamily property management company operating 50 properties. Without variance analysis, property managers can’t quickly spot which properties are underperforming or why. With systematic variance analysis, they discover:
| Property | Variance Type | Variance % | Primary Cause | Key Insights | Management Action |
|---|---|---|---|---|---|
| Property A | Revenue (Positive) | +5% (105% of forecast) | Stronger-than-expected rental rate growth driven by high market demand. | Indicates opportunity to further optimize rent pricing and capture favorable market trends. | Implement dynamic pricing models and adjust rent renewal strategy across similar properties. |
| Property B | Revenue (Negative) | –8% | Higher-than-expected vacancy rates due to delayed unit turnovers and local competition. | Reveals underperformance tied to leasing and retention inefficiencies. | Conduct leasing audit, improve tenant retention programs, and launch digital marketing campaigns. |
| Property C | Expenses (Negative) | +12% Overspend | Unexpected HVAC system failures and unplanned maintenance costs. | Highlights vulnerability in maintenance forecasting and capital reserve planning. | Introduce predictive maintenance schedules and allocate higher reserves for critical systems. |
| Property D | Expenses (Positive) | –3% Underspend | Efficient energy and utility management through smart monitoring systems. | Demonstrates operational best practice that reduces utility expenses portfolio-wide. | Replicate energy-saving measures and negotiate better vendor contracts across all properties. |
Armed with this data, management can:
This data-driven approach directly improves forecasting accuracy for next year’s budgets and reduces surprise expenses.
Risk management in real estate demands proactive identification of threats to financial performance. Variance analysis provides the early warning system.
By tracking variances monthly or quarterly, CFOs spot trends before they become crises. A consistent pattern of 3-4% expense variance across maintenance categories might signal:
These insights enable risk mitigation strategies: locking in supplier contracts, scheduling preventive maintenance, or budgeting equipment replacement reserves.
Variance analysis also supports scenario planning. If analysis shows a 2% market rent decline impacts revenue by 5%, CFOs can model what happens if rents decline 5% or 10%, enabling contingency planning and stress testing of financial projections.
If variance analysis shows you consistently underestimate maintenance costs by 8%, you can adjust next year’s budget upward. If you consistently overestimate occupancy rates, you can implement more conservative assumptions. If you underestimate tenant turnover costs, you can build larger reserves.
This variance-to-forecast loop creates a learning system where each year’s analysis improves next year’s accuracy. Over time, forecast reliability increases, enabling:
Better forecasts start with analyzing past variances. The gap between historical forecasts and actual results reveals systematic biases in your forecasting process.

Despite its value, many real estate firms struggle to execute variance analysis effectively.
Data fragmentation ranks as the top barrier. Property information lives in multiple systems: accounting software tracks expenses, property management platforms record rent collections, facilities management tools log maintenance requests. Without a centralized data hub, manually gathering information for variance analysis is time-consuming and error-prone.
Timing issues create another problem. Month-end close processes often take two weeks or longer. By the time variance reports are ready, actionable insights arrive too late for timely decision-making.
Staffing gaps compound the challenge. Controllers responsible for audit preparation, financial reporting, and compliance have limited capacity for detailed variance analysis. Accountants lack training in variance investigation techniques.
Categorization inconsistencies plague accuracy. Without standardized account codes and chart of account structures, expense transactions get categorized differently, making period-to-period comparisons unreliable.
Leading firms implement these proven approaches:
| Best Practice | Description |
|---|---|
| 1. Establish Clear Forecasting Baselines | Build budgets using historical performance, market data, and realistic assumptions. Maintain consistent forecasting methods each year to ensure meaningful comparisons. |
| 2. Automate Data Collection | Integrate accounting, property management, and banking systems so variance reports update automatically with real-time data, reducing manual work and errors. |
| 3. Review Variances Regularly | Conduct monthly variance reviews to spot early trends, and quarterly deep dives to identify root causes and corrective actions. |
| 4. Set Variance Thresholds | Define thresholds (e.g., >5% or >$10,000 variance) to focus investigations on significant deviations instead of small, immaterial differences. |
| 5. Document Root Cause Analysis | Record the reasons for major variances and the actions taken. This builds institutional knowledge and improves future forecasting accuracy. |
| 6. Link Variance Insights to Strategy | Use insights from variance trends to guide strategic choices — acquisitions, dispositions, market focus, and capital allocation. |
External auditors closely examine whether financial statements reflect actual performance versus forecasts. Significant unexplained variances raise audit concerns about control effectiveness or management judgment reliability.
Firms with systematic variance analysis processes demonstrate strong internal controls, earning auditor confidence and typically receiving fewer audit findings. Auditors can quickly understand why actual results differed from forecasts, seeing that management investigated variances and responded appropriately.
This positions controllers for better audit outcomes, fewer management letters, and reduced compliance risk—particularly important in an industry with increasing regulatory scrutiny around financial reporting, revenue recognition (ASC 606/IFRS 15), and reserve adequacy.
The property management software market is expanding rapidly to address these needs. Cloud-based platforms now integrate:
These systems reduce variance analysis time from days to hours, enabling real-time financial decision-making and proactive risk management.

Variance analysis transforms how real estate firms manage finances and risk. By comparing actual performance to forecasts, investigating discrepancies, and using those insights for better planning, controllers and CFOs gain the data foundation for smarter decisions.
The global real estate market’s 7.1% projected growth through 2029 creates both opportunities and risks. Firms that systematically analyze variances will navigate market changes more effectively, forecast more accurately, manage risks proactively, and build stronger relationships with auditors and investors.
Start implementing variance analysis today. Establish clear budgets, integrate your financial systems, review variances monthly, and use those insights to improve next year’s forecasts. The difference between reactive firefighting and proactive financial management often comes down to whether you’re analyzing variances—or ignoring them.
Key Takeaways:
1. What is variance analysis in real estate?
Variance analysis compares actual property performance (income, expenses, projects) with forecasts to find and explain financial differences.
2. Why is variance analysis important?
It helps CFOs and controllers detect revenue shortfalls, cost overruns, and risks early—improving budgeting, compliance, and audit readiness.
3. What are the main types of variance analysis?
Key types include revenue, expense, capital expenditure, budget percentage, and cost/schedule variance.
4. What is an example of variance analysis?
If rent was forecasted at $500K but actuals were $475K, the $25K unfavorable variance shows occupancy or collection issues needing correction.
5. What are the steps in variance analysis?
6. What are the benefits of outsourcing variance analysis?
Outsourcing variance analysis ensures accurate, timely financial insights handled by experts. It reduces errors, improves cost control, and helps management focus on strategic decisions instead of manual reporting.
7. How does variance analysis improve forecasting?
It reveals recurring budget errors, helping firms adjust assumptions and make future forecasts more accurate.
8. How can technology help with variance analysis?
Modern property management software automates data collection, reporting, and variance dashboards—saving time and reducing manual errors.
Contact us for a customized NO OBLIGATION proposal for outsourcing your accounting activities.