Your Guide to Designing and Building an Efficient Financial Dashboard
- January 26, 2022
- admin@ohi
Financial dashboards are comprehensive management tools that help organizations to keep track of relevant financial KPIs and take quick actions on the pressing financial issues. Financial management dashboards help with providing an efficient cash management solution that allows keeping a check on factors such as revenue, expenditure, profitability, etc.
In today’s fast-paced world, the need for real-time information to make any important decision is paramount. Financial dashboards allow exactly this, and they help businesses measure data accurately and provide valuable financial insights. They allow financial professionals to easily search for relevant information by making it available at their convenience.
A Financial dashboard is a great way to present a snapshot of your company’s financial success or failure. A financial management dashboard is more like a one-stop platform for addressing all financial queries related to the business. Let’s delve deeper into some of the prominent steps to follow to build a financial dashboard.
There are several things we need to keep in mind while building a financial performance dashboard. Here are the important pointers one should consider while building their dashboard.
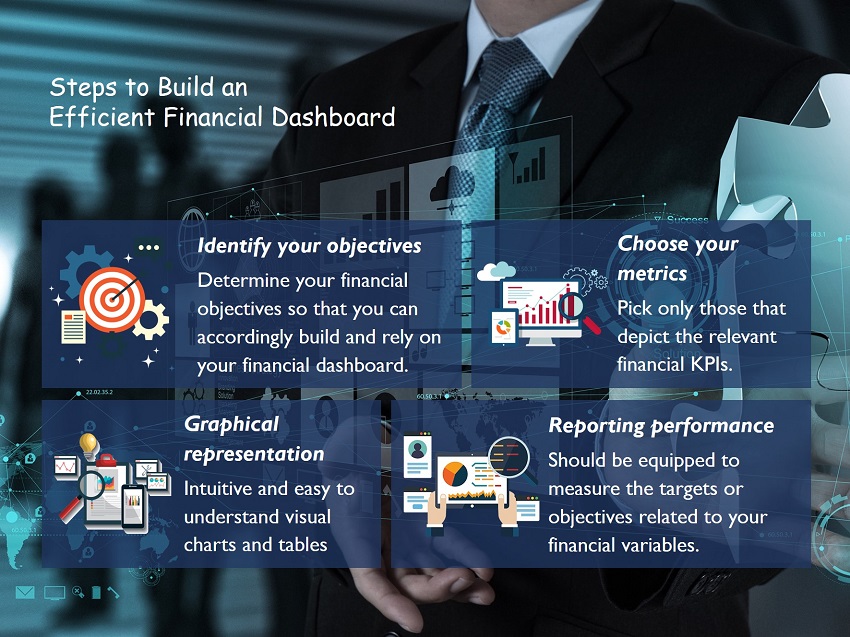
It is very crucial to determine your financial objectives in advance so that you can accordingly build and rely on your financial dashboard. In case you are using a balanced scorecard, a financial perspective will be a good place to start building your dashboard. This measure is a straight forward one and helps you to keep a tab on financial variables such as expenses, profits, revenue, etc. However, the variables of this overview are lagging financial indicators as they provide information related only to the last month or quarter.
A good financial dashboard should include financial metrics that provide a broad overview of the financial health and performance of your business. There are a whole lot of financial variables that you can include, but you need to pick only those that depict the relevant financial KPIs. This might vary depending on the type of organization, but usually, the common ones include variables like profit, cash flow, sales, etc.
There are two important considerations that you should keep in mind while choosing your financial dashboard metrics. The first one is that you should refrain from displaying a huge amount of data and keep it flexible so that you can access the details when required. Secondly, you should be able to get some valuable insights from the data by summarizing them instead of reporting data blandly.
Another important consideration is making it relevant to the audience. You should prepare the financial dashboard as per the requirements of the audience. You should know who will be using the dashboard, what type of stats they need, and where it will be published. For example, the financial dashboard on your website is for the general audience and doesn’t require a detailed overview. The dashboard presented to the stakeholders of the company, on the other hand, will have a more detailed metric.
Your financial dashboard acts as a barograph of financial performance and should be able to indicate your organization’s overall fiscal health. Some financial metrics are best suited to depict the trends over a long duration while other metrics might reveal the performance for a particular accounting period. The metrics that are suited to depict trends overtime include revenue, net profit, and more, whereas a ratiometric, along with other ratios, can be used to display the performance of the current period.
A financial analysis dashboard should help you analyse your performance and growth. Your financial dashboard should also be equipped to measure the targets or objectives related to your financial variables. The targets will simply display your estimates related to a particular variable and help to identify whether your organization’s performance was below or above the benchmark set by you in the beginning. This will tell the analysts or target audience about your financial performance and help design strategic measures required to make the business successful.
You should always use graphical presentation tools like charts and bar graphs in your financial dashboards. These graphical representation tools help the audience to quickly grasp the information without spending much time scrolling around irrelevant indicators. You can use some best practices followed while creating your graphical indicators such as ‘Year-on-Year Performance’ for a cyclical metric, displaying the status for single data points, combining multiple metrics, using similar tools for all metrics, etc.
Graphical representation is known to make the job more interesting and visual representation helps tracking the changes better. So when preparing your financial analysis dashboard, it is advisable to include graphical representation.
Here are some important tips that can help you create your ideal financial dashboard with ease.
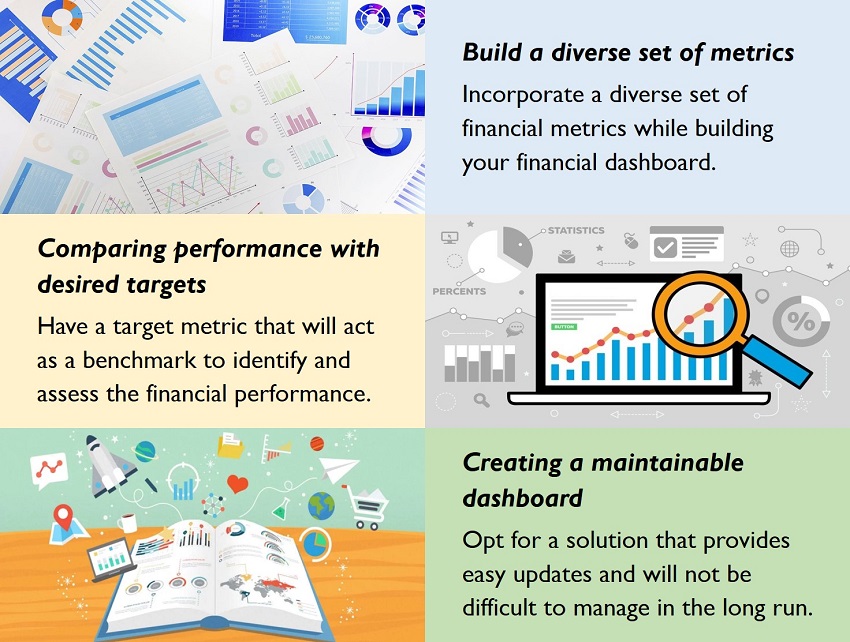
It is recommended to incorporate a diverse set of financial metrics while building your financial dashboard so that eventually, the organization would be able to identify what matters and what doesn’t. Giving more options to your professionals will help bring good results.
They will be able to understand all the relevant and important metrics only after a process of experimentation. Some of the prominent areas that you should focus on while integrating metrics in your financial dashboard include operating results for the organization, balance sheet measures, fundraising-related indicators, etc.
It is important to have a target metric that will act as a benchmark to identify and assess the financial performance of an organization. Displaying target figures adjacent to your actual performance using graphic tools helps communicate better with the audience and provides them with an interesting comparison. It helps identify the areas where your performance is lagging, and you can also prepare strategies to tackle the situation.
One of the most important things that you should keep in mind while creating a dashboard is that it should be easily maintainable. There are many ways to build a great financial dashboard using tools like Microsoft, Salesforce etc. You can even opt for an automated dashboard using specialized platforms these days.
Instead of going for a high-profile tool to create a financial dashboard, you should opt for solutions that will provide easy updates and will not be difficult to manage in the long run. You should definitely refrain from over-engineering your financial dashboard if you want an easy to use and manageable solution.
OHI is a specialized finance and accounting outsourcing service provider with over fifteen years of finance and accounting outsourcing experience. We have strong functional outsourcing expertise in end to end accounting processes covering daily accounting activities, reconciliations, month end and year-end account finalization processes, employee reimbursements, payroll processing, financial reporting and management dashboards. Our financial performance dashboards have helped businesses for years and helped them track their progress and strategize accordingly.
OHI serves close to 300+ clients across USA, UK and Canada.
Learn More About Our Real Estate Financial Dashboard Services: Portfolio Level Dashboards | Rental Dashboards | Financial Dashboards | Executive Summary – VIEW MORE