
Unlocking Business Insights: Top Power BI Dashboard Examples
- March 21, 2024
- OHI
In the fast-paced world of business intelligence and data visualization, Power BI has emerged as a powerful tool for organizations to gain valuable insights from their data. With its interactive and visually appealing dashboards, Power BI provides a comprehensive view of key metrics and trends that drive informed decision-making.
In this article, we will explore some top Power BI dashboard examples that showcase the wide range of possibilities for better business insights. Whether you are tracking financial performance, analyzing lead sources, monitoring rent collection, or conducting market rent analysis, these dashboards can help you visualize data in a meaningful way to drive your business forward.
Let’s dive into specific examples of Power BI dashboards that showcase different scenarios and offer actionable insights:
At OHI, we have successfully implemented Power BI dashboards to transform the way we analyze and leverage our data. One of our most impactful dashboards is the Financial Dashboard, which provides a detailed overview of our income, expenses, and net profit, allowing us to make informed decisions based on real-time financial insights.
FINANCIAL DASHBOARD
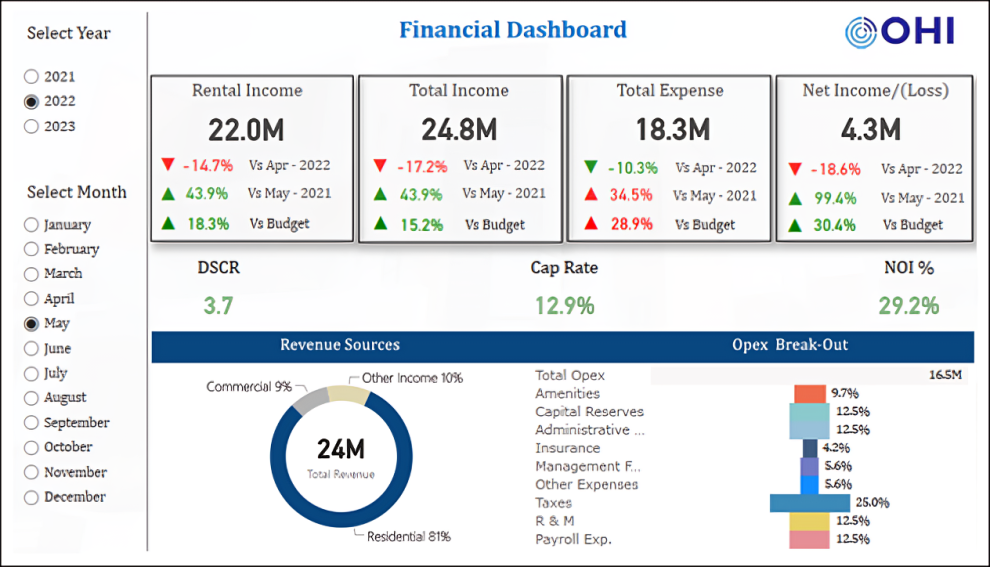
What this Dashboard shows
Make Smarter Business Decisions with This Data-Driven Dashboard
LEAD SOURCES DASHBOARD
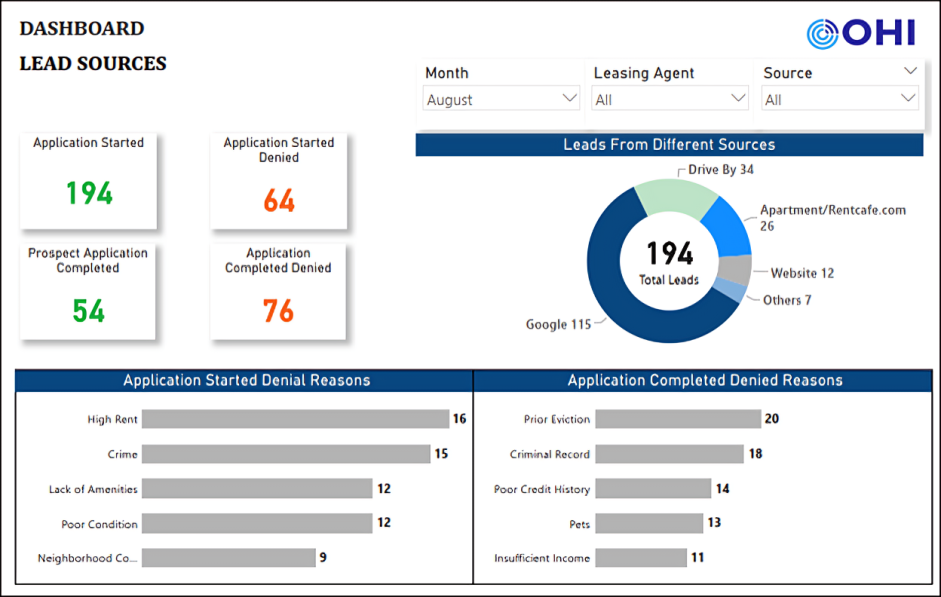
What this Dashboard shows
How this Dashboard Helps in Decision-Making
RENT BILLED VS RENT COLLECTED
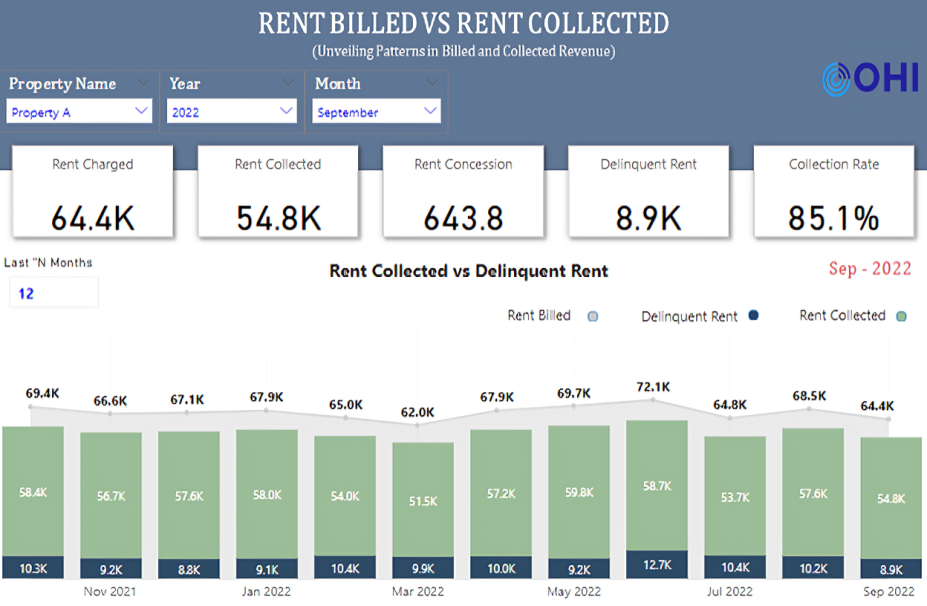
What this Dashboard shows
Boost Your Decision-Making: How Our Dashboard Fuels Growth with Data
MARKET RENT ANALYSIS
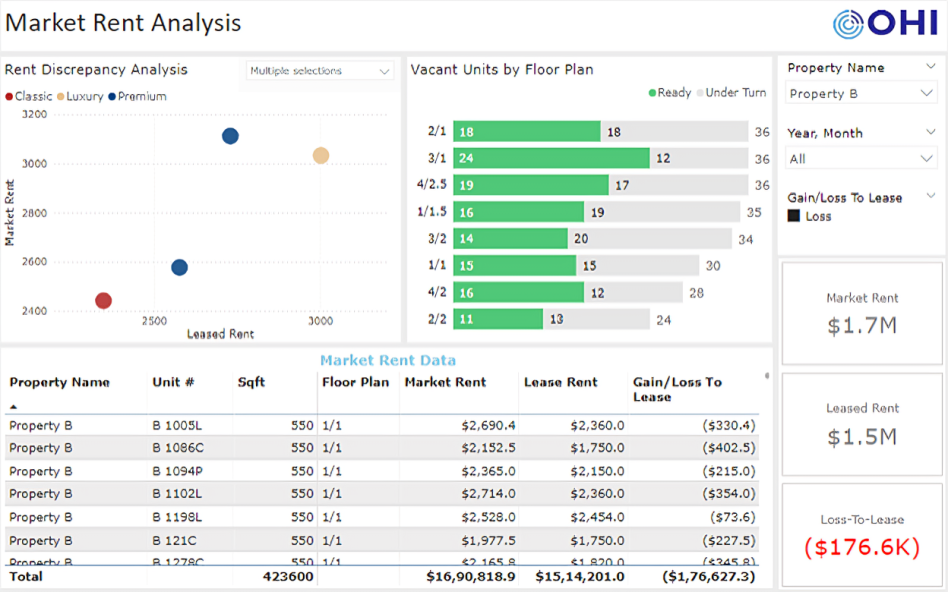
What this Dashboard shows
Streamline Operations and Maximize Revenue with Our Dashboard’s Insights
Power BI dashboards offer a dynamic way to visualize and analyze data, providing valuable insights for better decision-making in business. Whether you are a small startup or a large enterprise, leveraging Power BI dashboards can help you unlock hidden patterns and trends in your data to drive growth and success.
Discover the power of data visualization with Power BI and elevate your business intelligence capabilities to new heights. Start exploring these top Power BI dashboard examples today and unleash the full potential of your data-driven insights.