How to Estimate Rental Property Cash Flow: A Step-by-Step
- May 18, 2026
- OHI
Rental property cash flow analysis helps investors understand how much money remains after covering operating expenses, debt payments, and planned reserves. While most investors know the basic cash flow formula, the real challenge lies in the quality of the underlying data. Inaccurate rent rolls, manually updated NOI reports, and expense figures that lag behind actual performance can distort results and lead to poor decisions. This guide provides a step-by-step rental property cash flow analysis, explains the most common reporting pitfalls, and shows how to build a reliable financial reporting model for better investment decisions.
Key Takeaways
Most guides on cash flow analysis for rental properties focus on the calculations, as if the math is where investors struggle. It is not. Most property managers know the formula. What they do not always have is the right data, organized consistently, and pulled from the right systems at the right time. Without that, even the cleanest spreadsheet is just a very confident wrong answer.
Rental property cash flow refers to the surplus income a property generates after covering all operating expenses and debt service. The challenge is that this surplus is rarely static because the underlying numbers keep changing. Rental rates fluctuate, vacancy levels rise or fall, and maintenance costs can increase unexpectedly, all of which directly affect rental property cash flow over time.
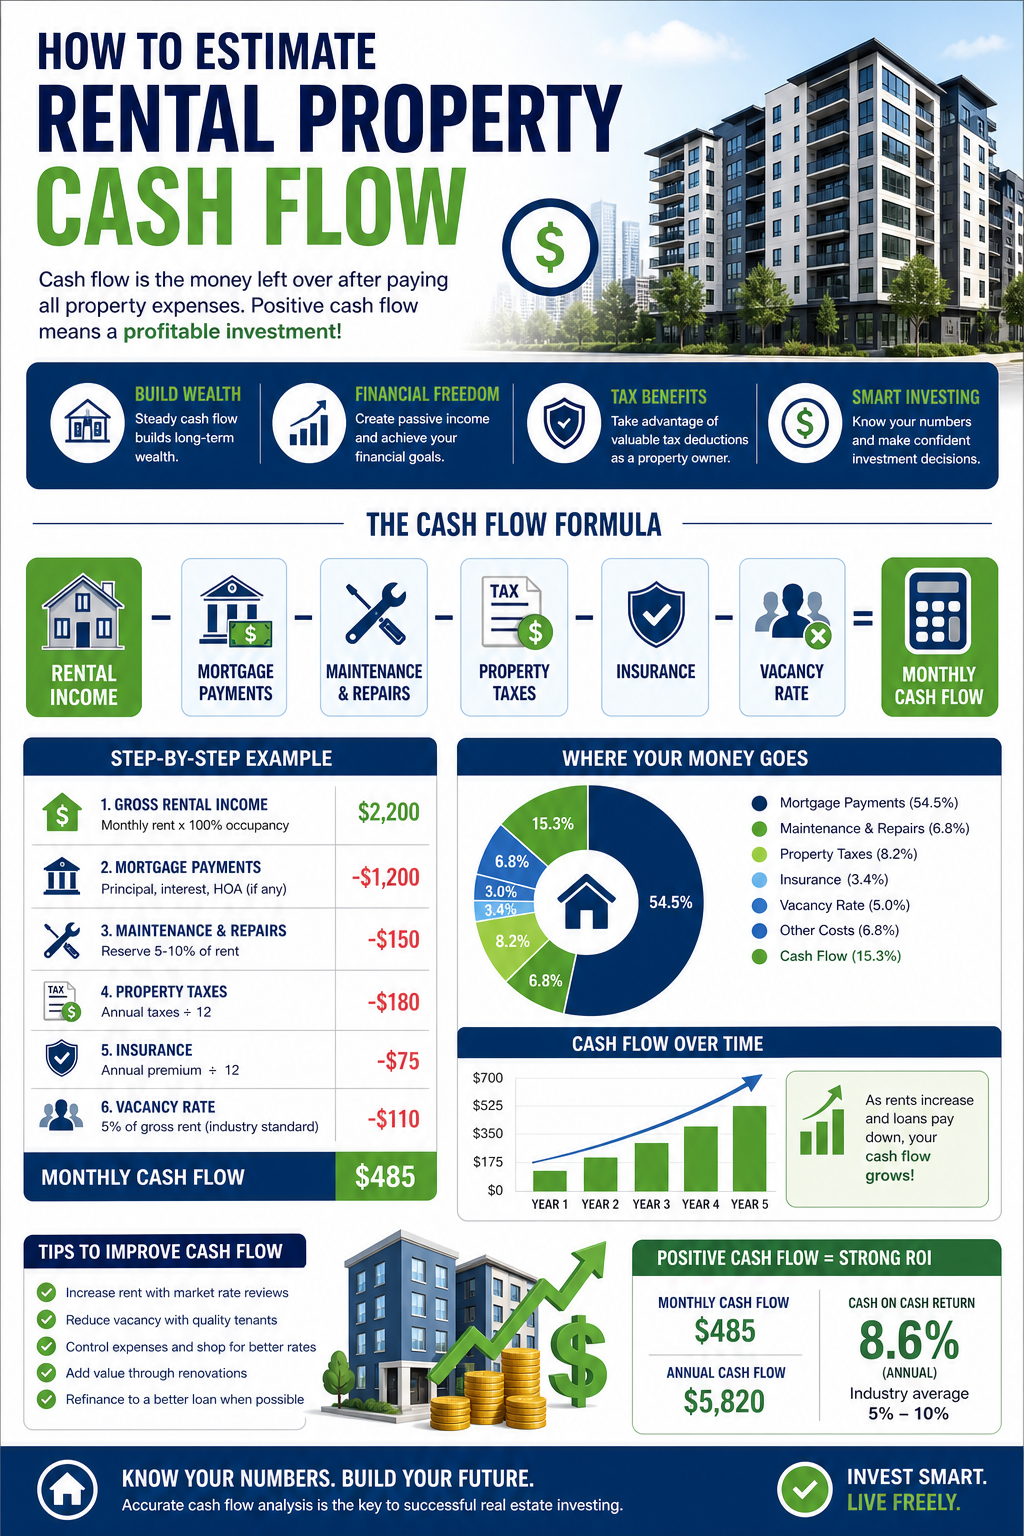
Gross Potential Income (GPI): The maximum rent that can be collected if every unit is occupied at full market rate, with no concessions or vacancies. This is the ceiling, not the number on which anyone should make decisions.
Effective Gross Income (EGI) is calculated by subtracting vacancy allowance and credit loss from GPI. In Residential Real Estate Accounting, accurately estimating vacancy rates is essential for reliable investment analysis. Strong markets typically see vacancy rates between 5% and 8%, while softer markets may range from 10% to 15%. Relying solely on a seller’s projected vacancy rate without proper verification can lead to inaccurate rental property evaluations.
Costs of running the business include property taxes, insurance, maintenance, management fees, utilities, and capital expenditure reserves. Operating costs usually take up 35% to 50% of the total rent. Older assets tend to be worth more.
NOI, or net operating income, is the difference between EGI and operating expenses. In the real estate industry, Property Management Services play a key role in improving NOI by controlling costs and maximizing rental income. NOI is a major indicator of a property’s profitability, helping lenders, investors, and asset managers evaluate property value and overall portfolio performance.
Rental property cash flow is calculated by subtracting debt service from net operating income (NOI). Positive rental property cash flow means the property generates surplus income after expenses, while negative cash flow means the owner must cover the shortfall out of pocket each month.
The rent roll is the first step in figuring out your cash flow. It shows the unit number, tenant name, lease dates, contract rent, and the rent actually paid. It is necessary when it is up to date. Everything built on top of it is wrong when it isn’t.
Industry analysis indicates that rent rolls totaling $50,000 monthly often reflect actual cash inflows that are 30% lower after accounting for rent concessions, free periods, and partial payments. That gap doesn’t show up until someone compares the rent roll to the general ledger. Many businesses don’t do this exercise regularly.
Old rent rolls don’t show lease renewals, move-ins, move-outs, rent increases, or changes in payment status. Every omission changes the predictions for cash flow later on.
Most businesses calculate NOI monthly, but comparing it to prior periods or the budget is a separate, often manual task. It takes a long time, doesn’t always work, or doesn’t work at all when it has to pull numbers from two different systems and combine them in a spreadsheet. Asset managers often know their current NOI, but they can’t quickly say why it changed or which properties aren’t doing as well as they should. That’s keeping records, not analyzing.
Most property management tasks don’t happen on just one platform. When a portfolio includes Entrata, Yardi, AppFolio, and MRI, you have to export data from each system, map account structures that don’t match, and resolve any problems before you can look at the rent rolls month by month. This can take a few days. By the time the analysis is complete, the data has already become outdated.
Good rental income analysis is a repeatable framework with consistent inputs, standardized structures, and automated refreshes that do not depend on someone spending a weekend in Excel.

The components that matter most:
Automated Rent Roll Comparison: Rent roll data is pulled directly from source systems monthly and annually, eliminating the need for manual combination. You can see every change to a unit or lease as it happens.
NOI Variance Tracking: Actual NOI compared to the budget and the previous period, with comments on the variance explaining why a line moved, not just that it did.
Debt Summary Reporting: A single place to see all of your financing’s current balances, payment schedules, and maturity dates. You should easily identify properties that are about to be refinanced.
The KPI dashboard with a historical view tracks occupancy, delinquency, collection rate, and cash flow per unit over at least 12 months. This way, trends can help you make decisions instead of just looking at one month at a time.
An Ontario-based real estate fund managing $554M AUM across Entrata and Yardi had a manual reporting problem. Debt summaries, rent roll comparisons, and NOI variance were all updated by hand, with no historical comparison framework. OHI consolidated both systems into a unified reporting layer, automated the core outputs, and built in 12-month trend visibility. The model was designed to scale as new properties were added; no rebuilding was required. Read the full case study here.
Most investors want single-family homes to make at least $100 to $200 a month, with a cash-on-cash return of 8% to 12% a year. Depending on the type of property and the market, a net operating income (NOI) margin of 50% to 65% is generally considered healthy for multifamily portfolios.
Any benchmark is only meaningful when tracked against consistent data. A target measured against stale rent rolls or manually reconciled NOI is not a benchmark. It is a guess.
OHI offers accounting and reporting outsourcing to real estate investment managers, property management companies, and asset managers in the US, UK, Canada, and Australia. Their teams work directly in Yardi, Entrata, AppFolio, MRI, and RealPage to provide standardized dashboards for rent roll analysis, NOI reporting, debt tracking, and portfolio-level reporting.
For growing portfolios where manual reporting creates delays, errors, or blind spots in cash flow visibility, explore OHI’s real estate accounting services or learn more about its asset management reporting capabilities.

To find your effective gross income, take your gross potential income and subtract your vacancy and credit loss. To find NOI, take away operating costs. Take away debt service. The result is cash flow before taxes. Not only the accuracy of the formula but also the quality of the data is important at each step.
The final number is wrong because rent rolls aren’t updated in real time, NOI is derived from systems that aren’t connected, vacancy assumptions are based on pro forma rather than actual performance, and expense figures are out of step with reality.
Automating rent roll comparisons, tracking NOI variance, and reporting debt across property management platforms eliminates manual steps where mistakes can occur. Standardized reporting structures, updated monthly, provide the consistency that one-off spreadsheets can’t.