Real Estate Underwriting: The Definitive Guide for Investors, Lenders & Borrowers
- July 10, 2026
- Amit K. Vatsayan

Real estate underwriting is the risk assessment process that happens before money changes hands. It answers one critical question: Will this deal work?
Underwriters evaluate three core elements:
If the answer is yes across all three, the deal moves forward. If not, terms change or the deal dies.
The term comes from Lloyd’s of London in the 17th century. Risk-takers literally wrote their names under insurance policies, accepting a share of the risk in exchange for premium payments. Today, real estate underwriting spans lending, insurance, investments, and securities.
| Type | Who Does It | What They Assess |
|---|---|---|
| Mortgage Underwriting | Banks, mortgage lenders | Borrower creditworthiness + property collateral value |
| Commercial Real Estate Underwriting | Lenders, investors, sponsors | Property cash flow, NOI, DSCR, market dynamics |
| Insurance Underwriting | Insurance companies | Property risk exposure, natural disaster probability, liability |
| Securities Underwriting | Investment banks | Real estate-backed securities, REITs, mortgage-backed securities (MBS) |
The real estate landscape has shifted dramatically. Interest rates remain elevated compared to the 2020–2021 lows. Construction costs have risen 30–40% since 2020. Cap rates are compressing in prime markets while expanding in secondary markets.
In this environment, sloppy underwriting destroys portfolios. Strong real estate underwriting saves them.
Here is what thorough underwriting prevents:
A well-underwritten deal survives market cycles. A poorly underwritten one becomes a case study in failure.

The underwriting process changes based on property type. Understanding the difference is essential.
Residential real estate underwriting centers on the borrower’s ability to repay. Lenders use the Three C’s framework:
Underwriters pull credit reports from all three bureaus (Equifax, Experian, TransUnion). They examine:
A borrower with a 750 credit score, 10% credit utilization, and zero late payments in 5 years presents minimal risk. A borrower with a 620 score, 80% utilization, and a recent foreclosure presents significant risk.
Capacity measures whether the borrower can afford the mortgage. Key factors:
Example DTI Calculation:
Borrower earns $8,000/month gross. Monthly debts: $400 car payment, $200 student loans, $150 credit cards = $750.
New mortgage payment: $2,400 (PITIA).
This borrower qualifies for most conventional programs.
The property itself must protect the lender. Underwriters verify:
Critical rule: If a borrower agrees to buy a home for $350,000 but the appraisal comes in at $300,000, the lender will not fund the full amount. The borrower must cover the $50,000 gap, renegotiate the price, or walk away.
Commercial real estate underwriting flips the focus. The property’s income must cover the debt. The borrower’s credit matters, but cash flow matters more.
Key metrics underwriters calculate:
Table
| Metric | Formula | What It Tells You | Healthy Benchmark |
|---|---|---|---|
| Net Operating Income (NOI) | Gross Income – Operating Expenses | Property profitability before debt service | Positive and growing |
| Debt Service Coverage Ratio (DSCR) | NOI / Annual Debt Service | Can the property cover loan payments? | 1.25 or higher |
| Loan-to-Value (LTV) | Loan Amount / Appraised Value | How much equity protects the lender? | Below 75% |
| Capitalization Rate (Cap Rate) | NOI / Property Value | Expected return if purchased with cash | Varies by market (4-10%) |
| Debt Yield | NOI / Loan Amount | Lender’s return if foreclosure occurs | 8-12% |
| Cash-on-Cash Return | Annual Cash Flow / Equity Invested | Investor’s cash return on equity | 8-15% typical |
| Internal Rate of Return (IRR) | Complex formula (Excel) | Total return over hold period including appreciation | 12-20% typical |
Example: Full Commercial Real Estate Underwriting Analysis
A 50-unit apartment building:
Loan request: $3,000,000 at 6.5% interest, 25-year amortization.
Appraised value: $4,500,000
Market cap rate for comparable properties: 7.5%
This deal passes underwriting comfortably.
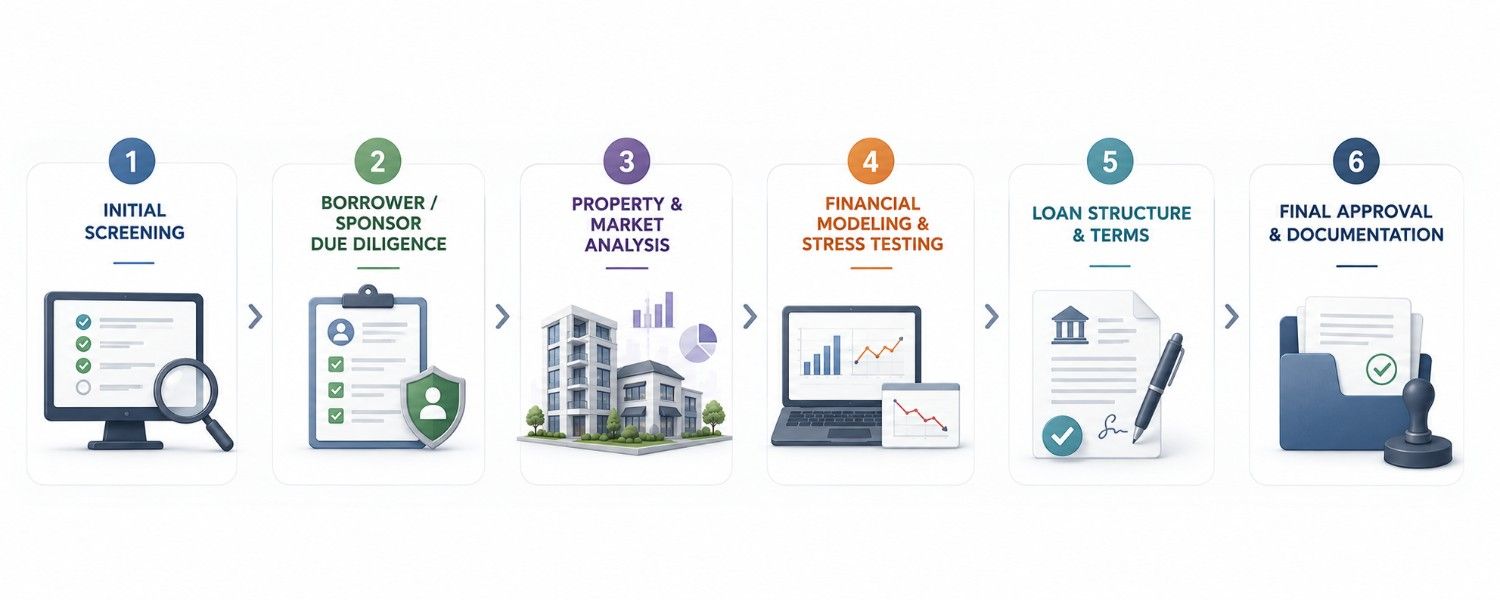
Every real estate deal, from a $200,000 home loan to a $200 million office acquisition, follows a similar real estate underwriting workflow. Here is the complete process.
The underwriter reviews the deal at a high level. Does it fit the lender’s or investor’s criteria?
Screening criteria include:
Reality check: At most platforms and institutions, 90-95% of deals fail initial screening. A sponsor pitching a $50 million hotel in a market with 40% vacancy will not make it past this step.
Who is driving this deal? Underwriters dig deep:
Personal/Entity Financial Review:
Track Record Verification:
Liquidity and Net Worth:
Red flag: A sponsor with zero experience in the proposed asset type. A developer who has only built single-family homes pitching a 200-unit multifamily ground-up development is a major risk.
Underwriters study the property and its operating environment:
Property-Level Analysis:
Market-Level Analysis:
Red flag: Appraisals in hot markets that exceed comparable sales by 15% or more. Inflated valuations based on speculative future rents rather than current market data.
Underwriters build or review detailed financial models. They do not trust pro formas from sponsors. They verify every assumption.
Base Case Model:
Stress Testing Scenarios:
| Scenario | Assumptions | What It Tests |
|---|---|---|
| Base Case | Sponsor’s projections | Whether the deal works as presented |
| Upside Case | Higher rents, faster lease-up, lower vacancy | Maximum return potential |
| Downside Case | Lower rents, slower lease-up, higher vacancy | Resilience to moderate adversity |
| Stress Case | Recession, tenant defaults, construction delays | Survival in worst-case scenario |
| Rising Rate Case | Interest rates increase 200 bps during hold period | Debt service coverage under pressure |
Critical rule: A deal that only works in the base case is not a good deal. The stress case must still show positive cash flow or the lender will reject it.
Based on risk assessment, the underwriter proposes loan terms:
Example Loan Structure:
| Term | Detail |
|---|---|
| Loan Amount | $5,000,000 |
| Interest Rate | SOFR + 325 bps (current: 8.75%) |
| Term | 36 months + two 12-month extensions |
| Amortization | Interest-only |
| LTV | 70% |
| DSCR Minimum | 1.25x |
| Guaranty | Non-recourse with standard carve-outs |
| Reserves | 6 months debt service + replacement reserve |
The deal moves to final decision:
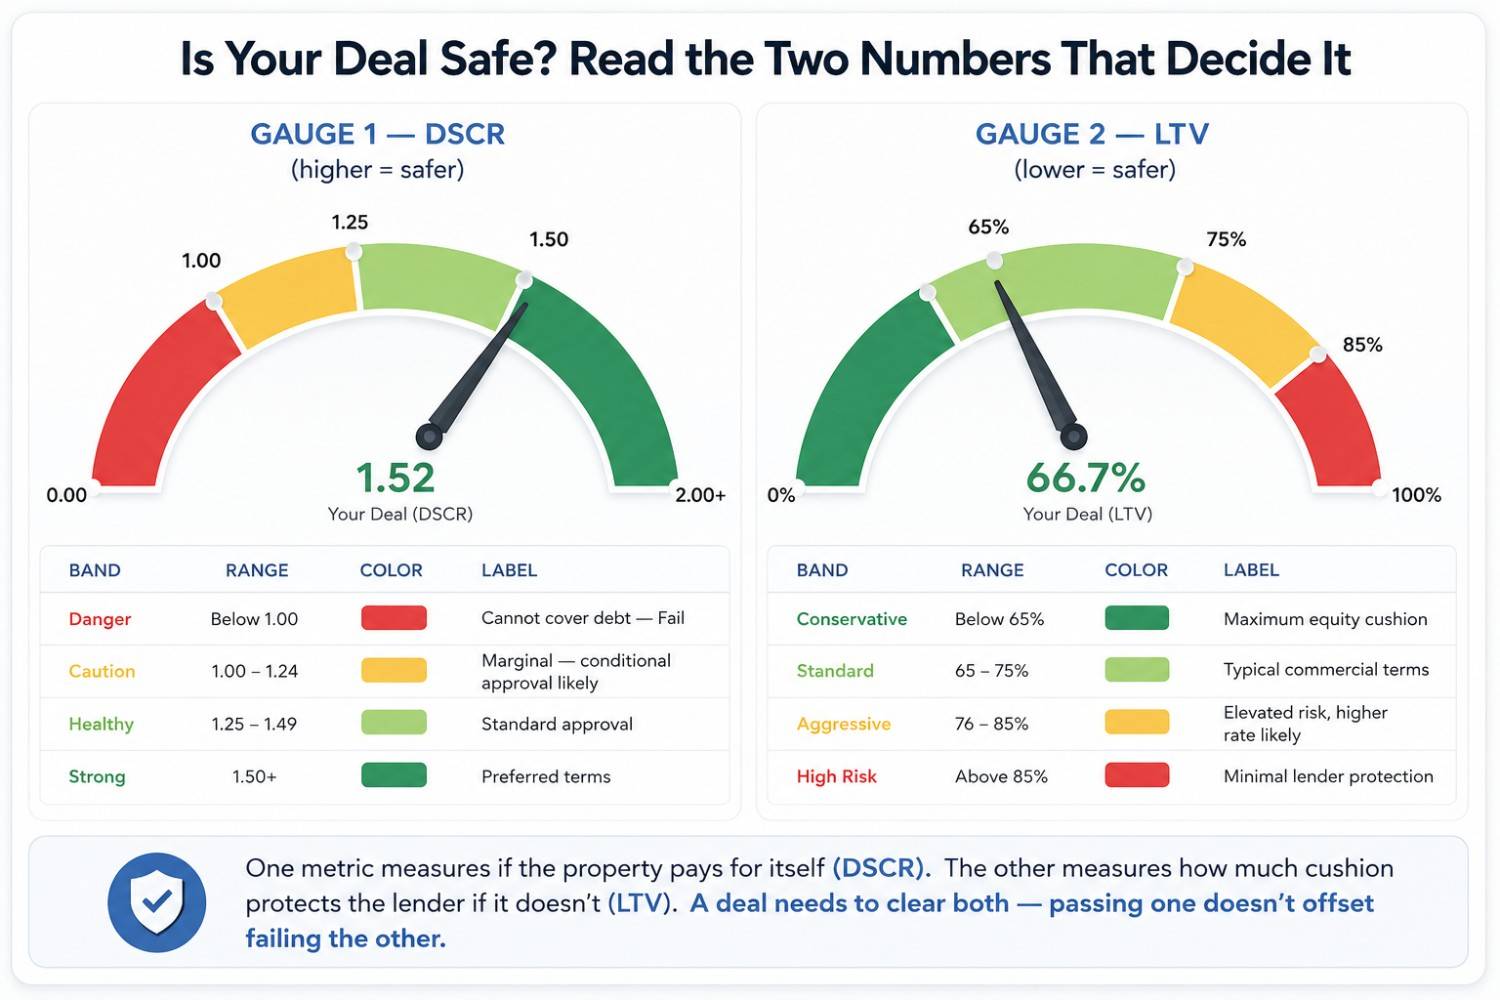
Metrics are the language of real estate underwriting. Here is how to calculate and interpret each one.
NOI is the property’s income after operating expenses but before debt service, capital expenditures, and depreciation.
Formula:
NOI = Gross Potential Income – Vacancy Loss + Other Income – Operating Expenses
Example:
| Item | Amount |
|---|---|
| Gross Potential Rent | $800,000 |
| Vacancy Loss (8%) | ($64,000) |
| Other Income (parking, laundry) | $25,000 |
| Effective Gross Income | $761,000 |
| Property Taxes | ($120,000) |
| Insurance | ($45,000) |
| Utilities | ($30,000) |
| Maintenance | ($55,000) |
| Management Fees (3%) | ($22,830) |
| Marketing | ($8,000) |
| Total Operating Expenses | ($280,830) |
| NOI | $480,170 |
DSCR measures whether NOI covers debt payments. It is the most important metric in commercial underwriting.
Formula:
DSCR = NOI / Annual Debt Service
Example 1: Strong Deal (PASS)
Example 2: Borderline Deal (CONDITIONAL)
Lender may approve with higher rate, lower LTV, or interest reserve.
Example 3: Weak Deal (FAIL)
Property cannot cover debt. Loan denied.
LTV compares the loan amount to the property’s appraised value.
Formula:
LTV = Loan Amount / Appraised Value
Scenarios:
| Loan Amount | Appraised Value | LTV | Risk Level |
|---|---|---|---|
| $3,000,000 | $5,000,000 | 60% | Conservative |
| $3,750,000 | $5,000,000 | 75% | Standard |
| $4,250,000 | $5,000,000 | 85% | Aggressive |
| $4,750,000 | $5,000,000 | 95% | High Risk |
Cap rate shows the return an investor would earn if they bought the property with all cash.
Formula:
Cap Rate = NOI / Property Value
Example:
Market Comparison:
| Market | Typical Cap Rate | Risk Profile |
|---|---|---|
| Prime NYC/DC office | 4.0-5.5% | Low risk, low return |
| Major metro multifamily | 5.0-6.5% | Moderate risk |
| Secondary market retail | 7.0-9.0% | Higher risk |
| Tertiary market industrial | 8.0-10.0% | Highest risk |
Debt yield measures the lender’s return if they foreclose. It ignores interest rates and amortization.
Formula:
Debt Yield = NOI / Loan Amount
Example:
Most lenders require minimum 8-10% debt yield.
Cash-on-cash measures the investor’s annual cash return relative to equity invested.
Formula:
Cash-on-Cash = Annual Cash Flow / Equity Invested
Example:
IRR is the annualized rate of return over the entire hold period, including cash flows and sale proceeds.
Calculation: Use Excel’s =IRR() function with all cash flows.
Example Cash Flows:
| Year | Cash Flow |
|---|---|
| 0 | ($2,000,000) — Initial equity |
| 1 | $160,170 |
| 2 | $165,000 |
| 3 | $170,000 |
| 4 | $175,000 |
| 5 | $2,500,000 — Sale proceeds + final cash flow |
IRR: ~14.2%
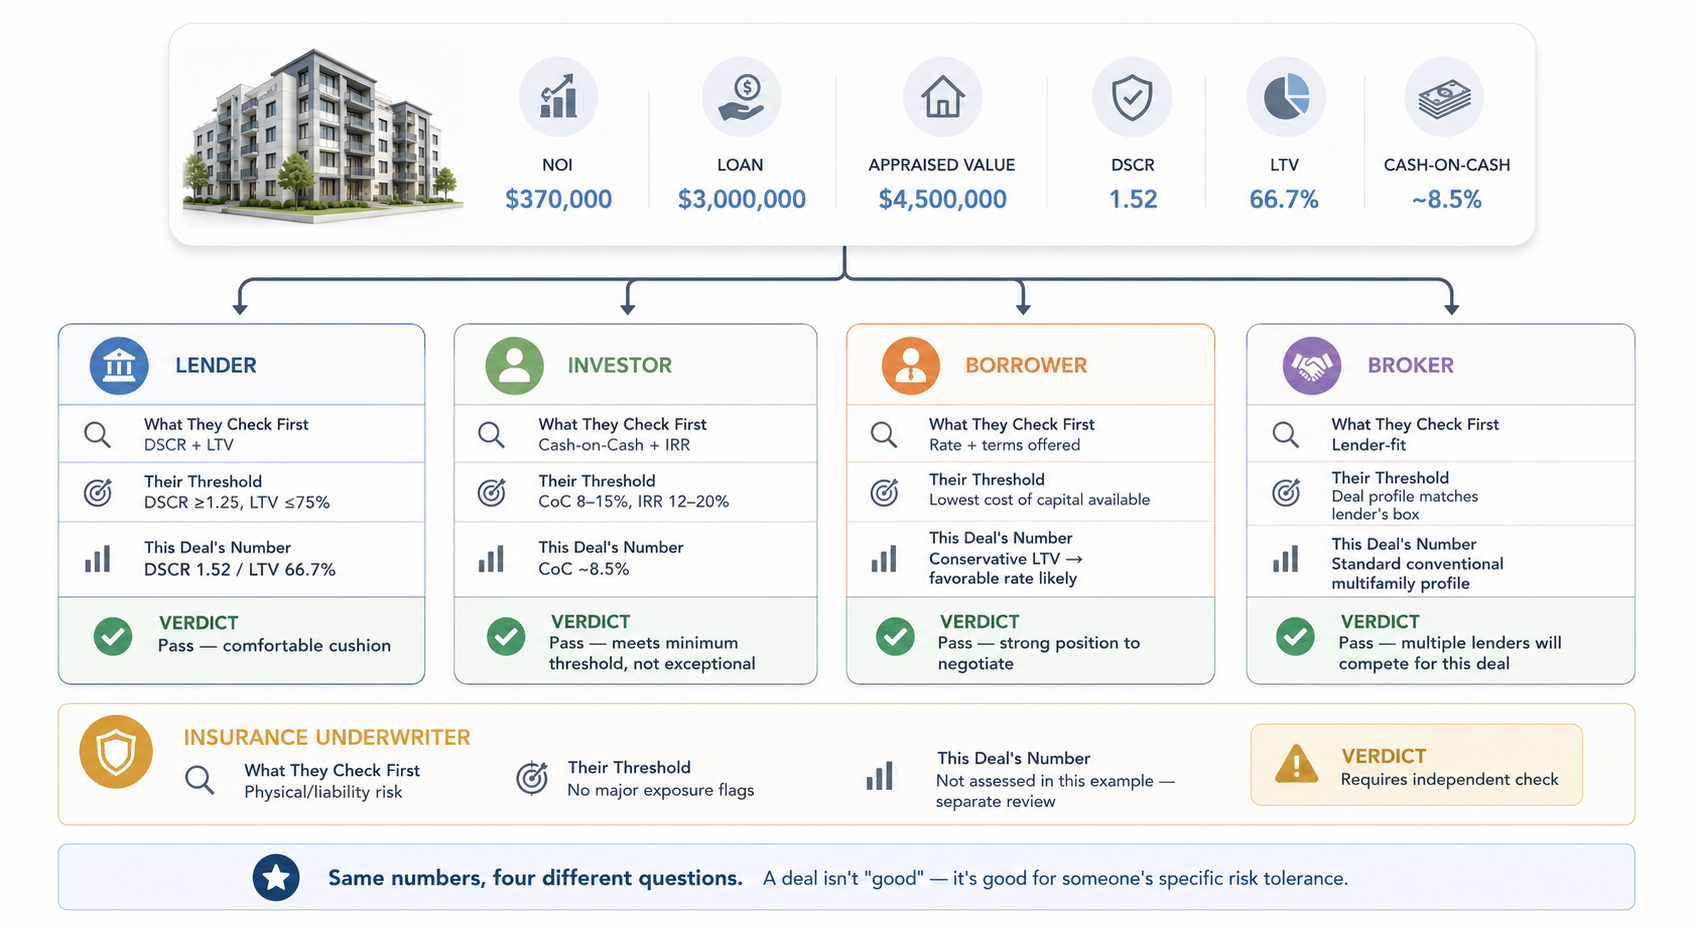
Real estate underwriting looks different depending on who you are. Here is how each stakeholder approaches it.
Lenders underwrite to protect their capital. Their priorities:
Key question: If the borrower defaults tomorrow, what is our loss severity?
Investors underwrite to find deals worth their capital. Their priorities:
Key question: Is the projected IRR worth the risk, given my alternative investments?
Borrowers underwrite their own deals to present them favorably. Their strategy:
Key question: How do I structure this deal to get approved at the lowest rate?
Brokers underwrite to package deals for lenders or investors. Their focus:
Key question: Which lender is the best fit for this specific deal?
Insurance underwriters assess physical risk to the property:
Key question: What premium adequately covers the probability and severity of loss?
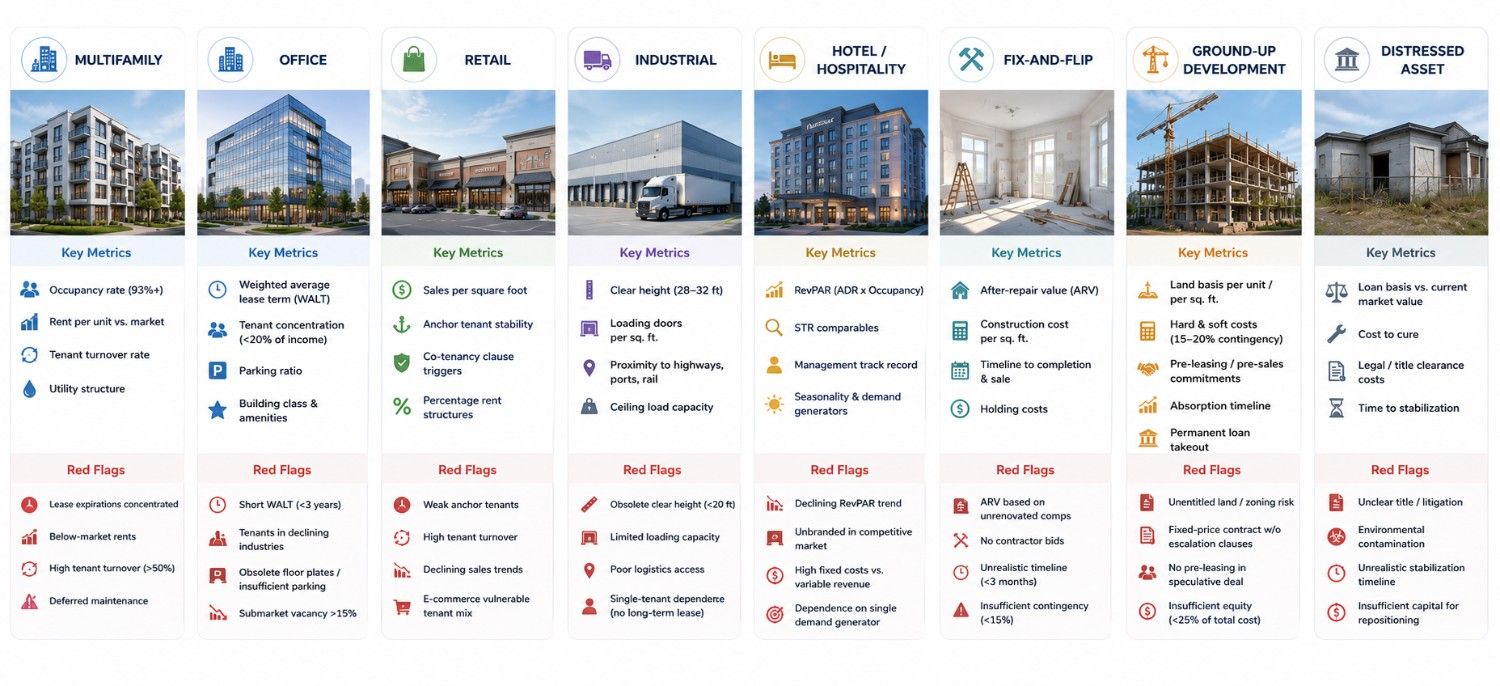
Each property type has unique real estate underwriting considerations.
Focus: Rent roll stability, lease expiration schedule, tenant demographics.
Key metrics:
Red flags:
Focus: Tenant credit quality, lease terms, remote work impact.
Key metrics:
Red flags:
Focus: Tenant mix, co-tenancy clauses, e-commerce resilience.
Key metrics:
Red flags:
Focus: Clear height, loading capacity, logistics access.
Key metrics:
Red flags:
Focus: Revenue per available room (RevPAR), management quality.
Key metrics:
Red flags:
Focus: After-repair value (ARV), construction cost accuracy, timeline.
Key metrics:
Red flags:
Focus: Entitlement risk, construction cost inflation, pre-leasing.
Key metrics:
Red flags:
Focus: Recovery analysis, repositioning cost, legal complexity.
Key metrics:
Red flags:

Market analysis is where many underwriters fail. Here is a systematic framework.
| Cycle Phase | Characteristics | Underwriting Adjustment |
|---|---|---|
| Recovery | Rising occupancy, rent growth beginning | Moderate optimism, standard underwriting |
| Expansion | Strong rent growth, new construction | Conservative assumptions, stress test for oversupply |
| Hyper-supply | New deliveries exceed absorption | Very conservative, higher vacancy assumptions |
| Recession | Falling rents, rising vacancy | Maximum stress testing, focus on in-place cash flow |
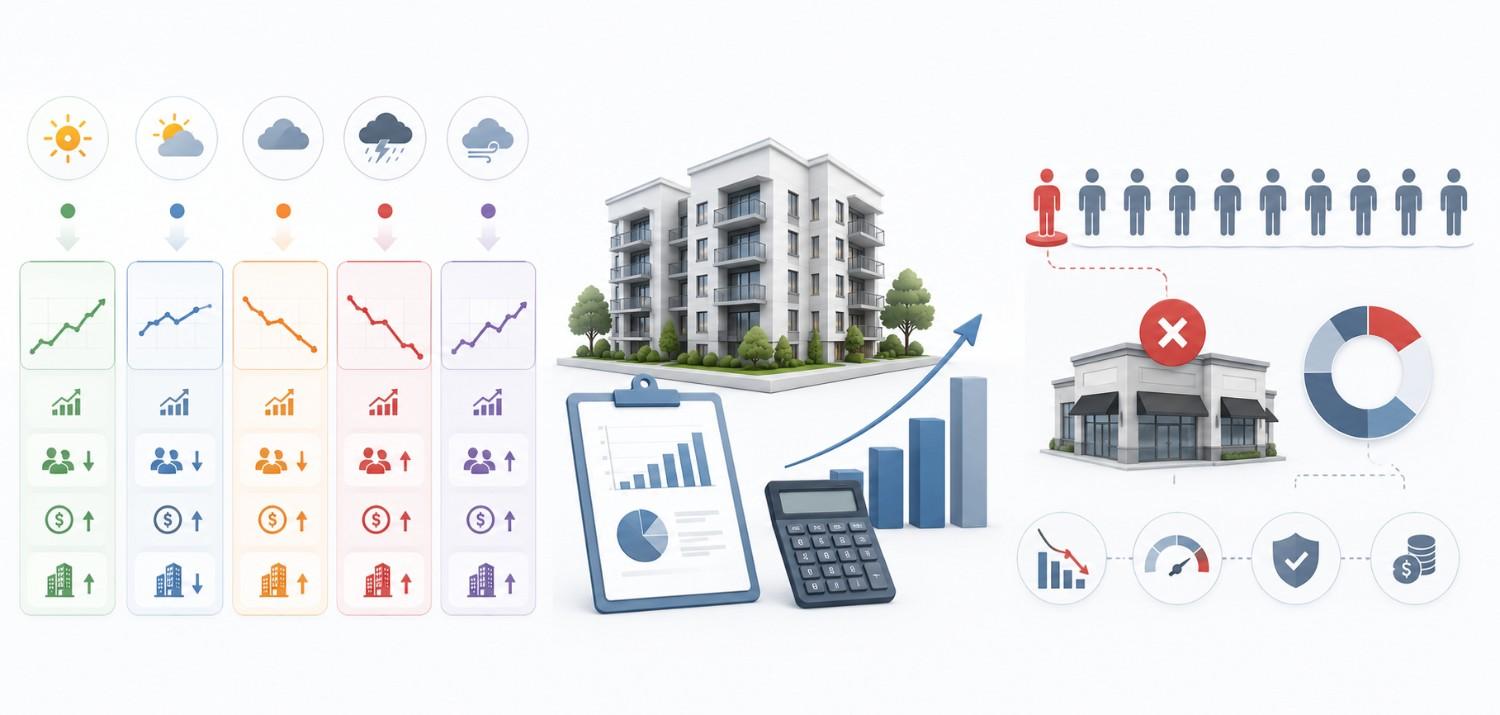
Stress testing separates professional underwriters from amateurs.
| Scenario | Rent Growth | Vacancy | Expense Growth | Exit Cap Rate |
|---|---|---|---|---|
| Base Case | Sponsor projection | Sponsor projection | 3% annually | Current market |
| Upside | +2% above base | -2% below base | 2% annually | -25 bps compression |
| Downside | -2% below base | +3% above base | 4% annually | +25 bps expansion |
| Stress | -5% below base | +5% above base | 5% annually | +75 bps expansion |
| Rising Rate | Base case | Base case | 3% annually | +100 bps + rate increase |
Base Case Assumptions:
Stress Test Results:
| Scenario | Year 5 NOI | Exit Value | Total Return | IRR |
|---|---|---|---|---|
| Upside | $620,000 | $10,890,000 | $4,200,000 | 18.2% |
| Base Case | $580,000 | $9,667,000 | $3,200,000 | 14.5% |
| Downside | $520,000 | $8,000,000 | $1,800,000 | 9.1% |
| Stress | $450,000 | $6,429,000 | $400,000 | 2.8% |
| Rising Rate | $580,000 | $8,286,000 | $1,900,000 | 9.5% |
Decision: The deal survives downside but fails stress. Lender may require lower LTV or interest reserve.
What if your largest tenant defaults?
Example:
Mitigation: Require tenant estoppels, review tenant financials, diversify tenant mix, or structure reserves.

Real estate underwriting has evolved. Today’s professionals use technology to move faster and reduce error.
Desktop Underwriter (DU) — Fannie Mae’s system analyzes borrower data in minutes.
Loan Product Advisor (LPA) — Freddie Mac’s equivalent platform.
Benefits:
Limitations:
AVMs use algorithms and comparable sales data to estimate property values instantly.
Providers: Zillow (Zestimate), CoreLogic, Black Knight, HouseCanary.
Best for: Low-risk refinances, portfolio monitoring, preliminary valuations.
Not for: Complex commercial properties, new construction, distressed assets.
Machine learning models analyze thousands of data points:
Benefits: More precise pricing, faster decisions, reduced bias.
Risks: Black box algorithms, data quality issues, regulatory uncertainty.
| Platform | Best For | Cost |
|---|---|---|
| CoStar | Commercial property data, comps, analytics | $$$$ |
| Reis (Moody’s) | Submarket forecasts, rent trends | $$$ |
| Yardi | Property management data, portfolio analytics | $$$ |
| RealPage | Multifamily market intelligence | $$$ |
| REIS (now part of Moody’s) | Market reports, forecasts | $$ |
| Costar Suite | Full CRE data ecosystem | $$$$$ |
| Software | Function | Best For |
|---|---|---|
| Argus Enterprise | Commercial cash flow modeling | Office, retail, multifamily |
| REFM | Excel-based real estate models | All property types |
| LoanLogics | Mortgage quality control | Residential lenders |
| Black Knight | Loan origination and servicing | Banks, mortgage companies |
| Trepp | CMBS analysis and surveillance | Wall Street, institutional |
| Blooma | AI-powered CRE underwriting | Lenders, investors |
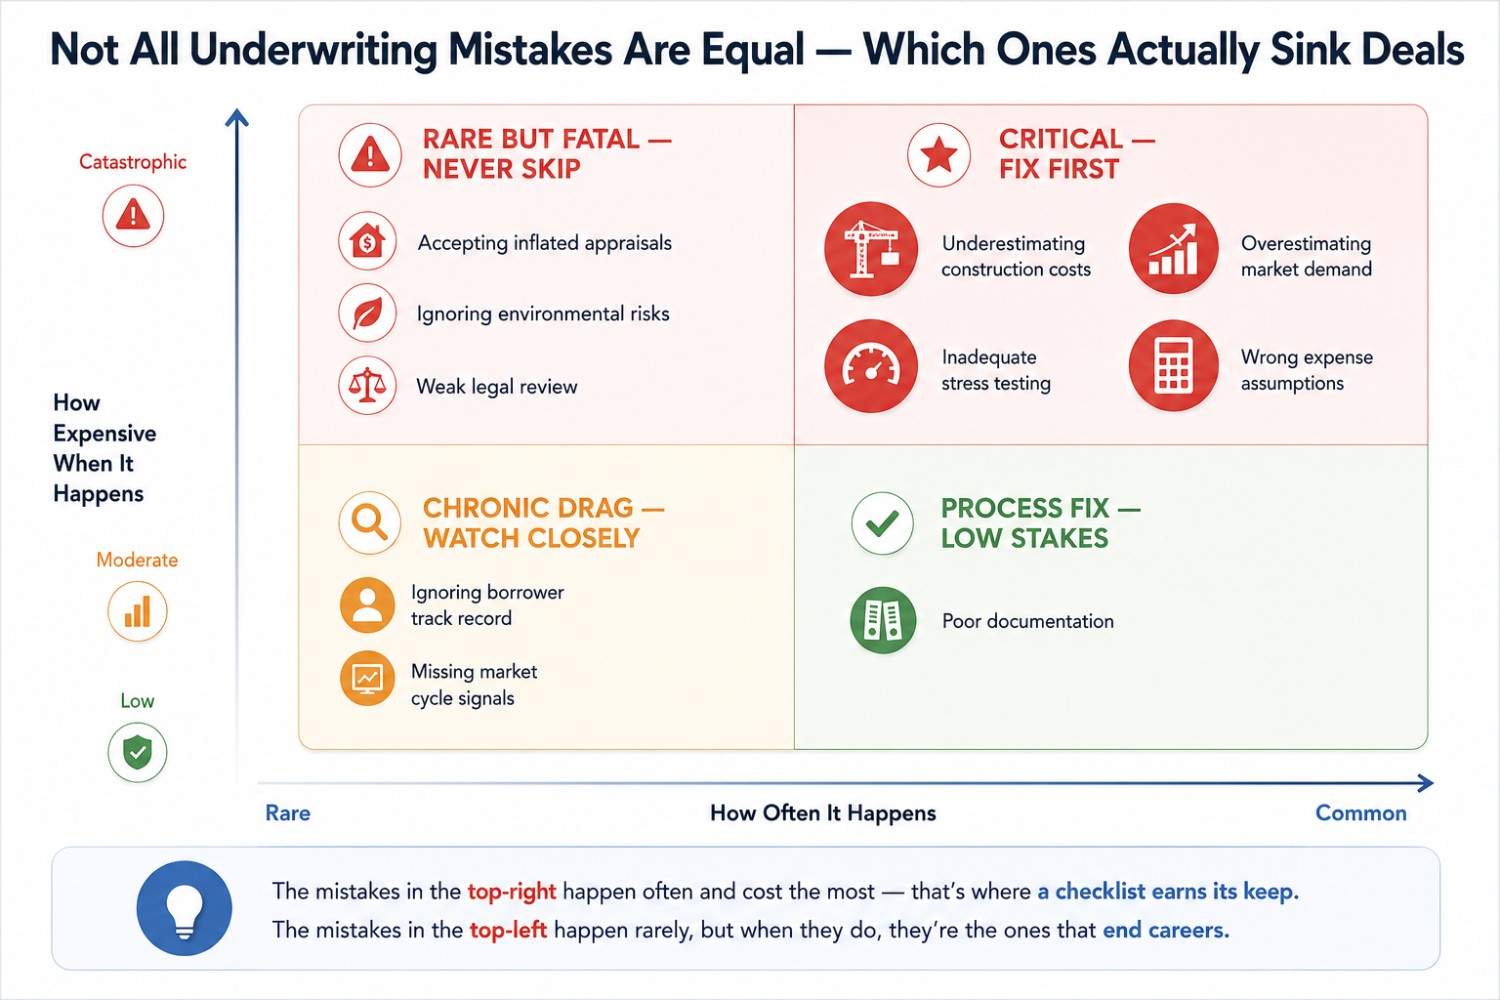
Even experienced underwriters make costly errors. Here are the most dangerous ones.
| # | Mistake | Why It Happens | How to Avoid It |
|---|---|---|---|
| 1 | Underestimating construction costs | Budgets lack contingency; optimism bias | Add 15-20% contingency; get multiple contractor bids |
| 2 | Overestimating market demand | Pro formas use best-case absorption | Use trailing 12-month data; stress test lease-up |
| 3 | Ignoring borrower track record | Focus on numbers, not people | Vet sponsor experience; check references |
| 4 | Accepting inflated appraisals | Pressure to close deals; hot markets | Review comps personally; order second opinion if needed |
| 5 | Poor documentation | Rushed timelines; incomplete files | Use standardized checklist; never skip steps |
| 6 | Missing market cycle signals | Recency bias; ignoring historical data | Analyze across multiple cycles; read market reports |
| 7 | Inadequate stress testing | Overconfidence in base case | Test 5 scenarios minimum; include recession case |
| 8 | Wrong expense assumptions | Using sponsor’s numbers without verification | Get actual T-12; benchmark against market |
| 9 | Ignoring environmental risks | Cost avoidance; assumption of clean site | Always order Phase I ESA; budget for Phase II if needed |
| 10 | Weak legal review | Rushing to close; trusting title abstract | Full title commitment; ALTA survey for commercial |
Borrower Red Flags:
Property Red Flags:
Market Red Flags:
Use this checklist for every deal. Do not skip steps.
What is real estate underwriting in simple terms?
It is the process of checking if a real estate deal is safe before money is committed. Underwriters look at the borrower, the property, and the market to decide if the risk is acceptable.
How long does real estate underwriting take?
Residential mortgage underwriting: 3-7 business days. Commercial real estate underwriting: 2-6 weeks. Complex development deals: 8-12 weeks.
What is a good DSCR for commercial real estate?
1.25 or higher is generally considered healthy. Below 1.20 is risky. Below 1.00 means the property cannot cover its debt payments.
What are the three C’s of underwriting?
Credit, capacity, and collateral. These apply primarily to residential mortgage underwriting.
What is the difference between underwriting and due diligence?
Real estate underwriting is the financial risk assessment. Due diligence is the broader investigation including legal, environmental, and physical property review. They overlap but are not identical.
Can I do my own real estate underwriting?
Yes, but it requires financial modeling skills and market knowledge. Many investors use platforms or hire professionals for complex deals. For single-family homes, online calculators and basic analysis may suffice.
What do underwriters look for in a borrower?
Credit history, income stability, debt-to-income ratio, cash reserves, employment history, and for commercial deals, track record with similar projects.
What do underwriters look for in a property?
Appraised value, condition, rent roll stability, operating expenses, market position, title clarity, and environmental compliance.
How do rising interest rates affect underwriting?
Rising rates increase debt service, which lowers DSCR. Underwriters use higher exit cap rates and stress-test cash flows more conservatively. Loan amounts may decrease to maintain DSCR thresholds.
What is an automated underwriting system (AUS)?
AUS is software that analyzes borrower data to make loan approval recommendations. Examples include Fannie Mae’s Desktop Underwriter and Freddie Mac’s Loan Product Advisor. They speed up decisions but require human oversight.
What is a cap rate in real estate?
Cap rate is the ratio of NOI to property value. It shows the expected return if an investor bought the property with all cash. A 6% cap rate means a 6% annual return before financing.
What is debt yield and why does it matter?
Debt yield is NOI divided by loan amount. It measures the lender’s return if they foreclose and sell the property. Unlike DSCR, it is not affected by interest rates or amortization. Most lenders require 8-10% minimum.
How do I become a real estate underwriter with no experience?
Start in a related role: credit analyst, loan processor, or brokerage research. Build Excel and financial modeling skills. Pursue REFM certification. Network with underwriters at industry events. Apply for analyst roles at banks, mortgage companies, or real estate investment firms.
What software do real estate underwriters use?
Excel (advanced), Argus Enterprise (commercial modeling), CoStar (market data), Yardi (property data), LoanLogics (mortgage underwriting), and various proprietary platforms.
Can real estate underwriting guarantee a successful investment?
No. Real Estate Underwriting reduces risk but cannot eliminate market fluctuations, natural disasters, or unforeseen events. Even well-underwritten deals can fail in extreme circumstances.
Real estate underwriting comes down to one test: does the borrower, the property, and the market all hold up under scrutiny — not just under a best-case pro forma. Lenders lose principal, investors lose capital, and developers run out of cash for the same reason: someone skipped a step, trusted an optimistic number, or ignored a red flag that was visible from the start.
The deals that survive rate cycles, oversupply, and tenant turnover are the ones stress-tested before the money moved, not after.
Use the checklist in Chapter 11 before your next deal. If a property can’t pass it on paper, it won’t pass it in practice.